FIB-SEM vs. X-ray CT: A Comprehensive Guide to 3D Catalyst Pore Characterization for Materials Scientists
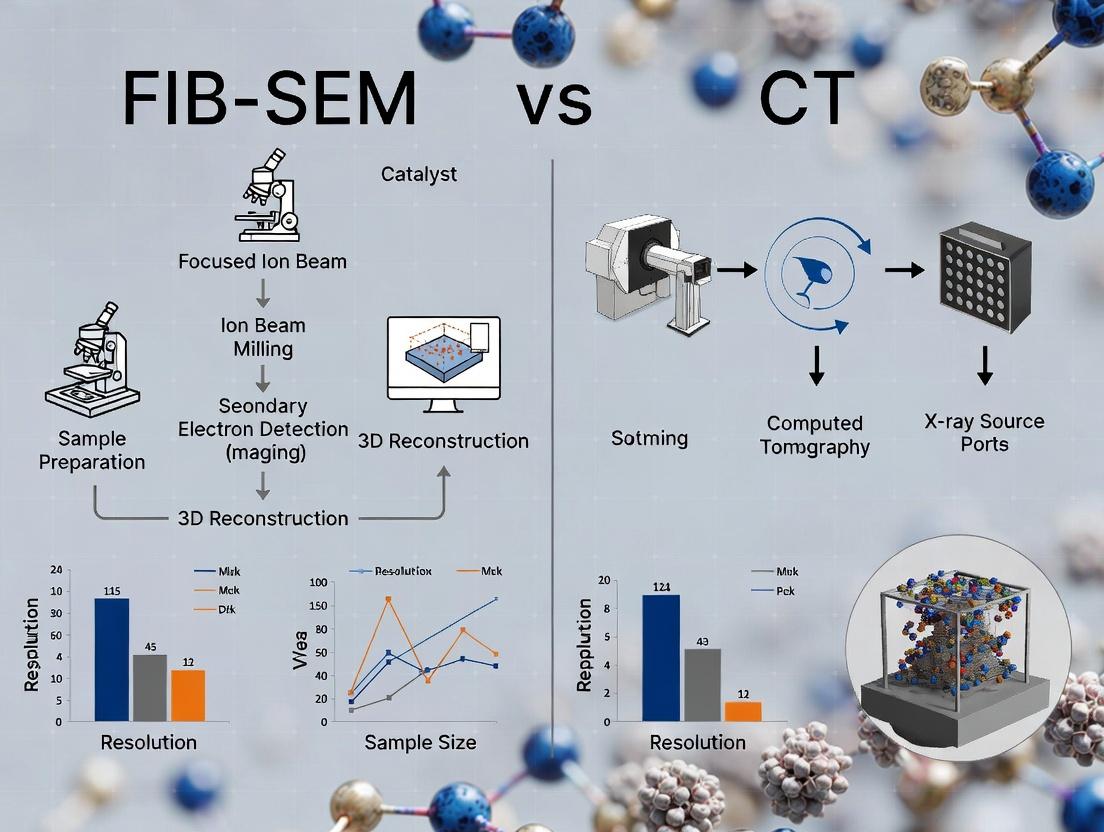
This article provides a detailed comparison of Focused Ion Beam-Scanning Electron Microscopy (FIB-SEM) and X-ray Computed Tomography (CT) for the critical task of three-dimensional catalyst pore structure characterization.
FIB-SEM vs. X-ray CT: A Comprehensive Guide to 3D Catalyst Pore Characterization for Materials Scientists
Abstract
This article provides a detailed comparison of Focused Ion Beam-Scanning Electron Microscopy (FIB-SEM) and X-ray Computed Tomography (CT) for the critical task of three-dimensional catalyst pore structure characterization. Aimed at researchers and development professionals in catalysis and materials science, the guide explores the foundational principles of each technique, outlines step-by-step methodologies for sample preparation and data acquisition, addresses common challenges and optimization strategies, and presents a direct, data-driven comparison of resolution, throughput, and analytical capabilities. The conclusion synthesizes the findings into a clear decision framework, empowering scientists to select the optimal imaging modality for their specific catalyst development and analysis goals.
The 3D Imaging Revolution: Understanding FIB-SEM and CT for Catalyst Porosity Analysis
Why 3D Pore Characterization is Critical for Catalyst Performance
Accelerating catalyst development in fields like catalytic converters, syngas production, and pharmaceutical synthesis requires moving beyond bulk metrics. Traditional techniques (e.g., BET, Hg porosimetry) provide averaged, often misleading, descriptors of porosity. A comprehensive thesis investigating FIB-SEM versus X-ray Computed Tomography (CT) for catalyst pore characterization reveals that true performance—governed by transport phenomena, active site accessibility, and durability—is dictated by the precise, three-dimensional architecture of the pore network. These 3D characteristics include tortuosity, pore size distribution gradients, interconnectivity, and the spatial correlation of phases. This application note details protocols and findings central to this thesis.
Quantitative Comparison of 3D Characterization Techniques
Table 1: Core Comparative Metrics of FIB-SEM vs. X-ray CT
| Parameter | Focused Ion Beam-SEM (FIB-SEM) | X-ray Computed Tomography (CT) |
|---|---|---|
| Resolution | 5-20 nm (typical) | 50-500 nm (lab-source); <50 nm (synchrotron) |
| Field of View | ~50 x 50 x 50 µm³ | ~1 mm³ to several cm³ |
| Sample Prep | Destructive (sectioning). Conductive coating often required. | Typically non-destructive. Minimal preparation. |
| Key 3D Metrics | Nanoscale connectivity, pore-throat size distribution, phase segmentation. | Macro/meso-pore network, tortuosity, density gradients, crack propagation. |
| Primary Limitation | Small volume may not be representative; artifacts from milling. | Resolution vs. volume trade-off; low contrast for similar Z materials. |
| Best For | Nano-porous coatings, zeolites, detailed interconnectivity at nanoscale. | Pellet/bead-scale networks, hierarchical structures, in-situ experiments. |
Table 2: 3D Pore Metrics Correlated to Catalyst Performance
| 3D Metric | Extraction Method | Impact on Catalyst Performance |
|---|---|---|
| Tortuosity (τ) | Computational flow simulation or path-length analysis on 3D model. | High τ increases diffusion resistance, lowering effective reaction rate, especially for mass-transfer-limited reactions. |
| Pore Network Connectivity | Euler number analysis, pore network modeling. | Poor connectivity leads to dead-end pores, trapping reactants/products and reducing active site utilization. |
| Pore Size Distribution Gradient | Local thickness transform across the 3D volume. | Optimal gradients (e.g., large to small pores) can enhance distribution while minimizing pressure drop. |
| Active Phase Spatial Distribution | Segmentation and co-localization analysis of multiple phases (e.g., support, active metal, promoter). | Clustered active phase blocks pores; uniform dispersion on pore surfaces maximizes accessibility. |
Experimental Protocols
Protocol 1: FIB-SEM Tomography for Nanoscale Catalyst Coatings Objective: To reconstruct the 3D pore network within a washcoat layer (<50 µm thick) on a monolith or pellet. Materials: Catalyst sample, sputter coater (Pt/Pd), dual-beam FIB-SEM, conductive epoxy.
- Sample Preparation: Mount a small fragment (∼1-2 mm) on a stub using conductive epoxy. Sputter-coat with a thin (5-10 nm) Pt/Pd layer to ensure conductivity and protect the surface during milling.
- Trench Milling: Using a high-current ion beam (e.g., 30 kV, 10-20 nA), mill a large trench in front of the region of interest (ROI) to create an imaging face.
- Serial Sectioning & Imaging: a. Set the ion beam to a lower current (e.g., 30 kV, 1-3 nA) for precise milling. b. Define an automated routine: (i) Mill a thin slice (5-15 nm) from the ROI face using the ion beam. (ii) Image the newly exposed cross-section using the electron beam (e.g., 2-5 kV, SE detector). (iii) Repeat for 500-1000 slices.
- Image Stack Processing: Align the image stack using cross-correlation. Apply noise reduction filters (e.g., non-local means). Segment pores, support, and active phases via thresholding (Otsu’s method) or machine learning classifiers (e.g., Trainable Weka Segmentation in Fiji).
- 3D Analysis: Reconstruct the volume. Calculate porosity, pore size distribution, and connectivity using software (e.g., Avizo, Dragonfly, or ImageJ/Fiji with 3D plugins).
Protocol 2: Lab-Source X-ray CT for Pellet-Scale Hierarchical Porosity Objective: To non-destructively quantify macro/mesopore networks and tortuosity within a full catalyst pellet (∼1-3 mm diameter). Materials: Catalyst pellet, lab-source micro-CT system (e.g., with Hamamatsu or Nikon X-ray source), mounting putty.
- Mounting: Secure the pellet on a styrene or carbon fiber mount using low-density putty to minimize scattering artifacts.
- Acquisition Setup: Optimize X-ray energy (e.g., 60-100 kV) and exposure time for sufficient transmission and contrast. Set voxel size to achieve desired resolution (e.g., 0.5-2 µm). Acquire 1500-3000 projections over a 360° rotation.
- Reconstruction: Apply a filtered back-projection or iterative reconstruction algorithm (e.g., FDK, SIRT) to generate a 16-bit grayscale 3D volume. Correct for beam hardening and ring artifacts.
- Multi-Scale Segmentation: Segment large macropores and cracks via global thresholding. Use local adaptive thresholding or a watershed algorithm to separate mesopores within the denser matrix. Differentiate phases based on grayscale histograms.
- Network Analysis: Skeletonize the binarized pore phase to extract the medial axis. Calculate tortuosity factors for different diffusion axes. Perform pore network modeling to simulate permeability and breakthrough curves.
Visualization: Workflows & Logical Relationships
3D Pore Analysis Decision Workflow
Pore Structure Impact on Performance Pathway
The Scientist's Toolkit: Key Research Reagent Solutions
Table 3: Essential Materials for 3D Catalyst Pore Characterization
| Item | Function & Importance |
|---|---|
| Conductive Epoxy (e.g., Ag paste, carbon cement) | Provides stable, electrical grounding for electron/ion beam techniques, preventing charging artifacts in FIB-SEM. |
| Sputter Coater (Pt/Pd target) | Applies an ultra-thin, conductive metal layer on insulating samples for FIB-SEM, ensuring clear imaging and surface protection during ion milling. |
| Dual-Beam FIB-SEM System | Integrates a focused ion beam for precise milling/sectioning and a scanning electron microscope for high-resolution imaging, enabling 3D nanoscale tomography. |
| Lab-Source Micro-CT System | Generates 3D volumes non-destructively using X-rays; essential for analyzing larger volumes (pellet/bead) and hierarchical structures. |
| Image Segmentation Software (e.g., Avizo, Dragonfly, Fiji) | Provides advanced algorithms (ML, watershed, thresholding) to accurately distinguish pore, support, and active phases from 3D image data. |
| Pore Network Modeling (PNM) Software | Extracts a simplified network of pores and throats from the 3D volume to computationally simulate fluid flow, diffusion, and reaction. |
| High-Purity Reference Materials (e.g., calibrated porosity standards) | Used for validation and calibration of both CT (attenuation) and FIB-SEM (milling rate, resolution) measurements. |
This document details the application of Focused Ion Beam-Scanning Electron Microscopy (FIB-SEM) for nanoscale three-dimensional characterization, specifically for catalyst pore networks. Within the broader thesis comparing FIB-SEM to X-ray Computed Tomography (CT), this protocol emphasizes FIB-SEM’s superior resolution (1-5 nm voxels) and its ability to resolve fine pore connectivity, amorphous phases, and surface composition—critical parameters for catalyst performance where CT’s micro-scale resolution and material contrast may be insufficient.
Foundational Principles & Quantitative Comparison
FIB-SEM operates on the principle of sequential, in-situ material removal via a focused Ga⁺ ion beam (typically 30 kV, 1 pA–65 nA) followed by high-resolution imaging via an electron beam (0.1–30 kV). This cycle is repeated hundreds to thousands of times to generate a stack of 2D images for 3D reconstruction.
Table 1: Key Quantitative Parameters for Catalyst Characterization
| Parameter | Typical FIB-SEM Range | Typical Micro-CT Range | Implication for Catalyst Research |
|---|---|---|---|
| Voxel Size | 1 nm – 50 nm | 0.5 µm – 5 µm | FIB-SEM resolves meso/micropores (<50 nm) crucial for active site accessibility. |
| Z-Resolution (Slice Thickness) | 3 nm – 30 nm | Equal to X-Y resolution | Precise control for thin slices through fine catalyst coatings. |
| Field of View (X-Y) | 1 µm – 50 µm | 1 mm – 10 mm | FIB-SEM trades volume for high resolution; targets representative regions. |
| Sample Volume | ~10³ – 10⁶ µm³ | ~1 – 1000 mm³ | CT analyzes bulk; FIB-SEM analyzes sub-volume for nanoscale detail. |
| Material Contrast | Compositional (BSE, EDS) | Density-based (X-ray attenuation) | FIB-SEM better distinguishes low-Z support materials (e.g., Al₂O₃, C) from pores. |
Detailed Application Notes & Protocols
Protocol 1: Sample Preparation for Porous Catalyst Monoliths
Objective: To create a stable, conductive, and artifact-free cross-section for sequential slicing.
- Sub-Sampling: Use a precision saw to extract a <5 mm segment from the catalyst monolith (e.g., automotive catalytic converter washcoat).
- Mounting: Adhere the sample to an SEM stub using conductive silver epoxy, ensuring the region of interest (washcoat layer) is perpendicular to the stub surface.
- Conductive Coating: Sputter-coat with a 10–20 nm layer of Iridium or Osmium. Iridium provides superior durability under prolonged ion beam exposure compared to Au/Pd.
- Protective Pad Deposition (Critical): In the FIB-SEM chamber, use the electron beam to deposit a 1 µm organometallic Pt pad (e.g., using (CH₃)₃CH₃C₅H₄Pt precursor) over the region of interest. Immediately deposit a 1–2 µm thick ion beam-induced Pt pad atop the first to protect the surface during initial milling.
Protocol 2: Sequential Slicing & Imaging for 3D Tomography
Objective: To acquire a registered image stack of a catalyst washcoat for 3D pore network analysis.
- Trench Milling:
- Use the Ga⁺ FIB (30 kV, 3–15 nA) to mill two deep trenches on either side of the protective Pt pad, creating an isolated lamella with imaging face.
- Mill a "cleaning cross-section" at the front of this lamella using a fine beam current (100 pA) to produce a smooth, artifact-free surface for the first image.
- Sequential Slice & Image Cycle (Automated):
- Slice: Remove a predefined thickness (e.g., 10 nm) using the FIB at a low current (e.g., 30 pA) for precise material removal.
- Image: Immediately image the freshly milled surface using the SEM at high resolution (e.g., 2 kV, 50 pA, 1024 x 884 pixels) with a Backscattered Electron (BSE) detector. BSE contrast is essential for differentiating pore (dark) from catalyst material (bright) based on atomic number.
- Registry: Maintain stage and beam stability; software aligns successive images.
- Cycle: Repeat for 500–2000 slices to build a volume (e.g., 15 µm x 15 µm x 5 µm).
- Post-Processing:
- Stack Alignment: Use cross-correlation algorithms (e.g., in Fiji/TrakEM2) to correct minor slice-to-stage drift.
- Segmentation: Apply machine learning-based segmentation (e.g., Trainable Weka Segmentation) to classify voxels into phases: pore, active metal particles (brightest), and support material.
- 3D Analysis: Calculate quantitative metrics (porosity, pore size distribution, tortuosity, connectivity) using Avizo or Dragonfly software.
Protocol 3: Correlative EDX Mapping for Compositional Analysis
Objective: To overlay elemental distribution onto the 3D structure at selected slices.
- Pause the automated slice-and-image cycle at strategic intervals (e.g., every 50th slice).
- Acquire an Energy Dispersive X-ray (EDX) spectral map at the freshly milled surface (e.g., 5 kV, 1 nA, 100 ms/pixel).
- Resume the automated slicing cycle.
- Integrate 2D elemental maps (for Pt, Pd, Rh, Ce, Al, O) into the 3D grayscale model to correlate pore structure with catalytic material location.
Diagrams
Title: FIB-SEM 3D Tomography Workflow for Catalysts
Title: FIB-SEM vs CT Selection Logic
The Scientist's Toolkit: Key Research Reagent Solutions
Table 2: Essential Materials for FIB-SEM Catalyst Characterization
| Item | Function & Rationale |
|---|---|
| Conductive Epoxy (e.g., silver dag) | Provides electrical grounding to prevent charging artifacts during SEM imaging. |
| Iridium (Ir) Sputtering Target | Source for high-density, fine-grain conductive coating; superior to Au/Pd for FIB durability. |
| Organometallic Pt Gas Injection System (GIS) Precursor | Used for in-situ electron and ion beam-induced deposition of protective pads to preserve surface structure. |
| Gallium (Ga) Liquid Metal Ion Source (LMIS) | Standard source for the FIB; provides precise, focused ions for milling and cross-sectioning. |
| Reference Catalyst Sample (e.g., NIST-traceable porous alumina) | Used for system calibration, validation of slice thickness, and image resolution checks. |
| Silicon Calibration Wafer | Used for precise SEM beam alignment and stage calibration prior to automated runs. |
| Anti-Contamination Cold Trap (e.g., N₂ liquid) | Reduces hydrocarbon contamination on the freshly milled surface, preserving image fidelity. |
In the comparative thesis on FIB-SEM vs. X-ray CT for catalyst pore characterization, X-ray Computed Tomography (CT) emerges as a non-destructive, three-dimensional imaging technique. Its core value lies in its ability to visualize and quantify the internal pore network, porosity, tortuosity, and active phase distribution within catalyst pellets or monoliths at the meso- to macro-scale (μm to mm), without the destructive sectioning required by FIB-SEM.
The fundamental principles enabling this are Absorption Contrast and Tomographic Reconstruction. This application note details these principles and provides protocols for their implementation in catalyst research.
Core Principle I: Absorption Contrast
Physical Basis
Absorption contrast in X-ray CT arises from the differential attenuation of X-rays as they pass through a heterogeneous material. The attenuation is governed by the Beer-Lambert law and is a function of the material's density, atomic number (Z), and the X-ray photon energy.
The linear attenuation coefficient (μ) quantifies the probability of interaction per unit path length. For a heterogeneous catalyst (e.g., Al₂O₃ support with Pt nanoparticles), variations in μ create the projection image contrast.
Key Dependencies for Catalyst Imaging
The contrast between different phases in a catalyst is maximized by optimizing the X-ray energy.
Table 1: X-ray Attenuation Properties of Common Catalyst Materials
| Material | Density (g/cm³) | Linear Attenuation Coefficient (μ) at 20 keV (cm⁻¹) | Linear Attenuation Coefficient (μ) at 40 keV (cm⁻¹) |
|---|---|---|---|
| γ-Alumina (Al₂O₃) | ~3.6 | ~14.5 | ~3.2 |
| Carbon | 2.2 | ~4.1 | ~0.9 |
| Platinum (Pt) | 21.4 | ~360.2 | ~105.5 |
| Nickel (Ni) | 8.9 | ~108.3 | ~27.8 |
| Void (Air) | 0.0012 | ~0.004 | ~0.0003 |
Note: Values are approximate; experimental calibration is required.
Experimental Protocol: Optimizing Absorption Contrast for Catalyst Samples
Protocol 2.3.1: Pre-Imaging Energy Optimization
- Sample Mounting: Secure the catalyst pellet (e.g., 100-500 μm diameter) on a low-attenuation pin (polymer or carbon fiber) using adhesive wax.
- Scout View: Acquire a single 2D radiographic projection at a moderate energy (e.g., 30 keV).
- Contrast Evaluation: Visually inspect the histogram of the projection image. Ideal contrast shows distinct peaks for void, support, and active metal phases.
- Energy Sweep (if instrument allows): Acquire projections at 5 keV increments from 15 keV to 50 keV.
- Analysis: Calculate the contrast-to-noise ratio (CNR) between phases of interest. Select the energy providing the highest CNR while ensuring sufficient transmission through the sample's thickest part (transmission > 10%).
Core Principle II: Tomographic Reconstruction
The Sinogram and Projection Acquisition
A set of 2D projection images is acquired by rotating the sample through 0 to 180° (or 360° for cone-beam). The collection of all projection data for a single slice is called a sinogram.
Reconstruction Algorithms
The transformation from sinogram to a 3D volume (stack of 2D slices) is achieved via reconstruction algorithms.
Table 2: Common Tomographic Reconstruction Algorithms
| Algorithm | Principle | Advantages for Catalysts | Disadvantages |
|---|---|---|---|
| Filtered Back Projection (FBP) | Analytical method. Projects filtered data back along original paths. | Fast, robust, standard for high signal-to-noise data. | Sensitive to noise, artifacts (streaking) with few projections. |
| Iterative (e.g., SIRT, SART) | Computationally reconstructs volume by iteratively comparing projections to a model until convergence. | Handles noisy data, limited-angle, or sparse-projection data well. Better for low-contrast materials. | Computationally intensive, slower, parameters (iterations, relaxation) need optimization. |
Experimental Protocol: Data Acquisition for High-Fidelity Reconstruction
Protocol 3.3.1: Tomographic Acquisition of a Catalyst Pellet
- Sample Preparation: Coat a fragile or low-Z catalyst sample (e.g., porous silica) with a thin (<50 nm) layer of conductive carbon to prevent charging in lab-based CT systems.
- Alignment: Precisely align the rotation axis to the center of the detector's field of view using a dedicated alignment routine.
- Acquisition Parameters:
- Voltage/Current: Set based on Protocol 2.3.1 (e.g., 40 keV, 200 μA).
- Exposure per projection: 1-3 seconds (optimize for >10,000 counts per pixel in brightest region).
- Number of projections: 1500-3000 over a 180° rotation.
- Pixel Size/Binning: Configure for a resultant voxel size of 50-70% of the smallest feature of interest (e.g., for 1 μm pores, use ~0.5 μm/voxel).
- Flat/Dark Field Correction: Acquire 20 flat fields (beam on, no sample) and 20 dark fields (beam off) before or after the scan to correct for detector inhomogeneity and noise.
- Reconstruction: Use FBP with a Parzen or Ram-Lak filter for high-quality data. For noisy data or low contrast between active phase and support, apply an iterative algorithm (e.g., 50 iterations of SIRT).
The Scientist's Toolkit: Key Reagent Solutions & Materials
Table 3: Essential Materials for X-ray CT of Catalysts
| Item | Function in Catalyst CT | Example Product/Note |
|---|---|---|
| High-Purity Silicon/PIN Diode Detector | Converts transmitted X-rays to electrical signal with high linearity and dynamic range. | Hamamatsu flat panel C7942, Dexela CMOS detectors. |
| Microfocus X-ray Source | Produces a cone-beam of X-rays with a small focal spot (<5 μm) for high geometric magnification. | Hamamatsu L12161, Varian/Comet X-ray sources. |
| High-Precision Air-Bearing Rotation Stage | Provides wobble-free sample rotation (runout <1 μm) critical for artifact-free reconstruction. | Aerotech ABRT series, PImicos. |
| Low-Attentuation Sample Mounts | Holds samples without obscuring features of interest. | Carbon fiber pins (e.g., MiTeGen), Kapton tubes, polymer glue. |
| X-ray Transparent Mounting Adhesive | Secures sample without damaging delicate structures or causing imaging artifacts. | Cyanacrylate-based glue (sparingly), two-part epoxy, thermal wax. |
| Dedicated Reconstruction Software | Converts projection sets into 3D volumes using FBP and iterative algorithms. | Thermo Fisher Amira-Avizo, Bruker CTvox/CTan, ASTRA Toolbox (open-source). |
| Beam Hardening Filter | Thin metal foil (e.g., Al, Cu) placed at source to pre-harden beam, reducing cupping artifacts. | Essential for lab-based CT of dense catalysts (e.g., with high metal loading). |
Visual Workflows
Title: X-ray CT Imaging Workflow for Catalysts
Title: Absorption Contrast Principle in Catalysts
In the comparative study of Focused Ion Beam-Scanning Electron Microscopy (FIB-SEM) and X-ray Computed Tomography (CT) for catalyst pore characterization, three key metrics define the capabilities and optimal application of each technique. The choice between FIB-SEM and CT is not trivial and hinges on the specific trade-offs between spatial/voxel resolution, field of view (FOV), and penetration depth. This application note details these metrics, provides experimental protocols for their determination, and situates them within a research framework for heterogeneous catalyst analysis, a field critical to energy and chemical engineering.
Quantitative Metric Comparison: FIB-SEM vs. Micro/Nano-CT
Table 1: Core Metric Comparison for Catalyst Characterization
| Metric | FIB-SEM (Typical Range) | X-ray Micro/Nano-CT (Typical Range) | Implications for Catalyst Research |
|---|---|---|---|
| Spatial (Lateral) Resolution | 1 - 10 nm | 50 - 500 nm | FIB-SEM resolves microporosity (<2 nm) & fine catalyst nanostructure. CT captures larger pore networks. |
| Voxel Size | 1x1x10 - 10x10x30 nm³ | 50x50x50 - 500x500x500 nm³ | FIB-SEM yields near-isotropic or anisotropic voxels for fine detail. CT voxels are typically isotropic. |
| Field of View (FOV) | 10 - 100 µm (per slice) | 0.1 - 100 mm (full volume) | CT provides contextual overview of a full pellet. FIB-SEM offers high-detail on a selected region. |
| Penetration Depth / Sample Size | < 100 µm (milled depth) | 0.1 - 50 mm (sample diameter) | CT is non-destructive for full pellets. FIB-SEM is destructive, revealing internal cross-sections. |
| Key Strengths | Ultra-high resolution, surface sensitivity, material contrast. | Non-destructive, large volume, fast acquisition, in-situ capability. | |
| Primary Limitation | Destructive, small volume, sample prep intensive. | Lower resolution, potential for beam hardening artifacts. |
Experimental Protocols
Protocol 1: Determining Practical Spatial Resolution in FIB-SEM for Catalyst Samples
Objective: To empirically determine the best achievable spatial resolution during a 3D FIB-SEM tomography run on a porous catalyst support (e.g., γ-Al₂O₃). Materials: FIB-SEM system (e.g., Thermo Fisher Scios 2, Zeiss Crossbeam), porous catalyst sample, conductive coating (carbon or Au/Pd). Procedure:
- Sample Preparation: Mount catalyst pellet on a SEM stub using conductive carbon tape. Apply a uniform ~10 nm conductive carbon coating via sputter coater to mitigate charging.
- Region of Interest (ROI) Selection: Image the sample in SEM mode at 2-5 kV. Identify a representative, flat region with visible porosity.
- Deposit Protective Layer: Use the gas injection system (GIS) to deposit a 1-2 µm thick layer of Pt or C over a 15x15 µm area on the ROI.
- Trench Milling: Use a high-current Ga⁺ ion beam (e.g., 30 nA) to mill trenches on two sides of the protected ROI to create a free-standing lamella with accessible cross-section.
- Fine Polish: Use successively lower ion currents (7 nA, 1 nA) to polish the cross-sectional face.
- Tomography Setup: Set the SEM imaging conditions (e.g., 2 kV, 50 pA, Through-the-Lens Detector). Define the slice thickness (e.g., 10 nm) and total milling depth (e.g., 20 µm).
- Resolution Test: Prior to starting the automated run, acquire a high-magnification image of the polished face. Measure the smallest discernible feature (e.g., pore edge, particle boundary). This defines the lateral spatial resolution.
- Automated Run: Execute the automated "slice-and-view" sequence (milling with a low current, e.g., 300 pA, followed by SEM imaging).
- Post-processing: Align image stack using cross-correlation (e.g., in Fiji/ImageJ). The voxel resolution is defined as (Pixel Size X, Pixel Size Y, Slice Thickness Z).
Protocol 2: Calibrating Voxel Size & FOV in X-ray Nano-CT
Objective: To calibrate the true voxel size and assess the relationship between FOV and resolution in a nano-CT scan of a whole catalyst pellet. Materials: X-ray nano-CT system (e.g., Zeiss Xradia 620 Versa), catalyst pellet (≤1 mm diameter), mounting pin. Procedure:
- Sample Mounting: Secure the catalyst pellet on a specialized pin mount using low-density adhesive (e.g., wax). Ensure it is vertically centered and stable.
- System Alignment: Perform geometric alignment and flat-field correction scans as per manufacturer protocol to correct detector inhomogeneities.
- Scout Scan: Perform a low-resolution/high-FOV scout scan at low magnification (0.4X objective) to position the sample accurately in the beam.
- Magnification Selection: Switch to a higher magnification objective (e.g., 4X or 20X) based on desired resolution. Note: Higher magnification reduces FOV.
- Voxel Size Calibration: The system software calculates voxel size as: Detector Pixel Size / Objective Magnification. Record this value (e.g., 64 nm for 20X objective).
- Determining FOV: The FOV is determined by the number of detector pixels and the voxel size. For a 1024x1024 detector at 64 nm/voxel, FOV = 65.5 µm.
- Acquisition: Set voltage (40-80 kV for catalysts), power, exposure time, and number of projections (typically 1601 over 360°). Start acquisition.
- Reconstruction: Use filtered back-projection or iterative reconstruction to create the 3D volume. Apply beam hardening and ring artifact corrections if needed.
- Validation: Measure a known feature (e.g., pellet diameter) in the reconstructed volume. Compare to physical measurement to validate calibrated voxel size.
Protocol 3: Assessing Penetration Depth & Signal Degradation in CT
Objective: To evaluate the effective penetration depth for a given catalyst material composition and X-ray energy. Materials: CT system, catalyst pellets of varying diameters (0.5 mm, 1 mm, 2 mm) of the same composition. Procedure:
- Sample Set Preparation: Prepare three pellets of the same catalyst formulation with controlled diameters.
- Fixed Parameter Scan: Scan each pellet sequentially using identical CT parameters (voltage, current, filter, exposure time, magnification).
- Reconstruction: Reconstruct each volume using identical parameters.
- Analysis of Sinograms: Inspect the raw projection images (sinograms). Note the projection angle where the X-rays passing through the sample center become too attenuated for the detector, resulting in complete signal loss or severe noise.
- Line Profile Analysis: Draw line profiles across a central projection image for each sample size. Plot grayscale value (attenuation) versus position.
- Determine Threshold: Identify the sample diameter where the attenuation profile in the center flattens into noise (SNR < 2:1). This diameter defines the practical penetration limit for those imaging conditions.
- Optimization: Increase X-ray voltage or apply a filter to achieve higher penetration for larger samples, acknowledging potential loss of contrast for lighter elements.
Visualizations
Diagram 1: Technique Selection & Data Fusion Workflow
Diagram 2: Comparative Experimental Workflows
The Scientist's Toolkit: Essential Research Reagents & Materials
Table 2: Key Reagents and Materials for FIB-SEM/CT Catalyst Characterization
| Item | Function/Description | Typical Product/Example |
|---|---|---|
| Conductive Carbon Tape | Provides electrical grounding for SEM samples, preventing charging artifacts. | Ted Pella Double-Coated Carbon Tape |
| Sputter Coater | Applies a thin, uniform conductive metal (Au/Pd) or carbon coating to non-conductive samples. | Leica EM ACE600 |
| Gas Injection System (GIS) Precursors | Organometallic gases (e.g., Pt, W) for ion- or electron-beam assisted deposition of protective layers. | (CH₃)₃CH₃C₅H₄Pt (Platinum precursor) |
| FIB-SEM Stubs | Specialized aluminum or stainless steel mounts compatible with stage tilt and rotation. | Zeiss ATLAS Multifunction Stub |
| X-ray Mounting Pins & Wax | Low-density, low-attenuation adhesive for securing delicate samples in CT without obscuring features. | M6 Threaded Pin, Paraffin Wax |
| Beam Hardening Filters | Thin metal foils (e.g., Al, Cu) placed in the X-ray beam to absorb low-energy photons, reducing artifacts. | 0.5 mm Aluminum Filter |
| Image Stack Alignment Software | Essential for correcting drift and misalignment in sequential FIB-SEM slices. | Fiji/ImageJ with "Linear Stack Alignment" plugin |
| 3D Segmentation & Analysis Software | For reconstructing, visualizing, and quantifying pore networks from 3D image volumes. | Thermo Fisher Avizo, Dragonfly Pro, ORS Visual SI |
| Density Standards (for CT) | Known materials (e.g., glassy carbon, polymer beads) for grayscale calibration and attenuation correlation. | Micro-CT Density Phantom (Bruker) |
Application Notes: Comparative Analysis of FIB-SEM vs. CT in Catalyst Characterization
Within a thesis investigating FIB-SEM (Focused Ion Beam-Scanning Electron Microscopy) versus X-ray Computed Tomography (CT) for catalyst pore characterization, the core value lies in the derived 3D data outputs. These outputs are critical for linking nanostructure to performance metrics in heterogeneous catalysis and related fields like drug delivery systems. The choice of technique directly impacts the accuracy and interpretation of these volumetric parameters.
FIB-SEM excels in high-resolution (down to ~3 nm voxel) imaging of small, representative volumes (typically 10³-10⁴ µm³). It provides exceptional detail for nanoporous structures but is destructive and may introduce artifacts via ion milling. X-ray CT (especially nano-CT and micro-CT) is non-destructive and captures larger sample volumes (up to mm³ scale), but often at lower resolution (>50 nm voxel), potentially missing finer pore networks. The complementary use of both techniques is a current best practice for multi-scale analysis.
The key quantitative outputs, their significance, and typical comparative values from recent studies (2022-2024) are summarized below.
Table 1: Key Data Outputs from FIB-SEM vs. CT for Catalyst Characterization
| Data Output | Definition & Significance | Typical FIB-SEM Range | Typical X-ray CT (nano-CT) Range | Primary Influence on Catalyst/Drug Carrier Performance |
|---|---|---|---|---|
| Volumetric Model | A 3D digital reconstruction of the solid and pore phases. Foundation for all subsequent calculations. | Very high resolution, limited field of view. | Larger field of view, potentially lower resolution. | Direct visualization of pore connectivity and active phase distribution. |
| Porosity (φ) | Volume fraction of void (pore) space to total material volume. | 20-60% (highly dependent on catalyst type) | 15-55% (may underestimate closed nanoporosity) | Determines available surface area and loading capacity for active species or drug molecules. |
| Tortuosity (τ) | A measure of the convolutedness of pore pathways. τ ≥ 1, where 1 is a straight channel. | 1.5 - 8.0 (for complex nanoporous supports) | 1.2 - 4.0 (often lower due to unresolved micropores) | Dictates mass transport efficiency and diffusion limitations; critical for reaction rates and drug release kinetics. |
| Pore Size Distribution (PSD) | The frequency distribution of pore diameters (nm to µm). | Bimodal common: 5-50 nm (mesopores) & 0.1-1 µm (macropores). | Often unimodal: 50 nm - 5 µm (macropores). Micropores (<2 nm) not detected. | Controls molecular accessibility, selectivity via size exclusion, and capillary forces. |
Experimental Protocols
Protocol 1: FIB-SEM Tomography for Nanoscale Pore Analysis
Objective: To generate a high-resolution 3D volumetric model of a catalyst pellet or porous particle for quantification of porosity, tortuosity, and PSD at the nanoscale.
Materials & Reagents:
- Catalyst sample (e.g., Pt/Al₂O₃ pellet).
- Conductive coating material (e.g., carbon sputter coater).
- FIB-SEM system with gas injection system (GIS) for Pt deposition.
- Serial sectioning/imaging software (e.g., AutoSlice & View, ORS Dragonfly).
Procedure:
- Sample Preparation: Mount the sample on a SEM stub. Apply a thin conductive carbon coat to prevent charging.
- Site-Specific Protection: Using the GIS, deposit a ~1 µm protective platinum strap over the region of interest (ROI).
- Trench Milling: Use high-current ion beam (e.g., 30 kV, 15 nA) to mill trenches on two sides of the ROI, creating a free-standing lamella.
- Serial Sectioning & Imaging: a. Set ion beam to a lower current (e.g., 30 kV, 1 nA) for precise milling. b. Set SEM imaging parameters (e.g., 2 kV, 50 pA, In-lens detector). c. Automate the cycle: Mill away a slice of predefined thickness (e.g., 5 nm) → Acquire a high-resolution SEM image of the freshly exposed face. d. Repeat for 300-500 slices to build a z-stack.
- Image Stack Processing & Segmentation: a. Align the image stack using cross-correlation algorithms. b. Apply noise reduction filters (e.g., non-local means). c. Perform segmentation (e.g., Trainable Weka Segmentation in Fiji, or deep learning models) to classify each voxel as solid or pore.
- 3D Reconstruction & Quantification: Generate the volumetric model. Calculate porosity (pore voxels / total voxels). Compute tortuosity via random walker or flow simulation algorithms. Calculate PSD using sphere-fitting or granulometry methods.
Protocol 2: X-ray Nano-CT for Meso/Macroscale Pore Analysis
Objective: To obtain a 3D volumetric model of a larger catalyst sample volume non-destructively for analysis of macro-pore networks and bulk porosity.
Materials & Reagents:
- Catalyst sample.
- Mounting pin or holder compatible with the nano-CT stage.
- X-ray transparent low-scattering glue.
Procedure:
- Sample Mounting: Securely mount the sample on the stage using minimal adhesive to avoid artifacts.
- Scout Scan & Setup: Perform a low-resolution scout scan. Define the ROI. Optimize source voltage (e.g., 40-80 kV for Zeiss Xradia) and filter (e.g., LE4) for contrast.
- Tomographic Acquisition: a. Set desired resolution (e.g., 50 nm voxel size). This determines field of view. b. Acquire projections over a 180° or 360° rotation (e.g., 1201 projections). c. Apply optical magnification (in systems like Xradia) for nano-CT. d. Use exposure times that maximize signal-to-noise (e.g., 20-60 sec/projection).
- Reconstruction: Reconstruct the 3D volume from sinograms using filtered back-projection or iterative algorithms (e.g., in XMReconstructor).
- Post-processing & Analysis: Apply ring artifact and beam hardening correction. Perform segmentation (e.g., Otsu's method, region growing). Calculate global porosity and PSD. Compute tortuosity on the binarized macro-pore network.
Protocol 3: Complementary Multi-Scale Workflow
Objective: To integrate FIB-SEM and CT data for a comprehensive pore structure analysis from nm to µm scale.
Procedure:
- Perform X-ray nano-CT on an intact catalyst pellet (Protocol 2).
- Identify a representative sub-region from the CT volume for high-resolution analysis.
- Using a micro-manipulator, extract a targeted lift-out from the exact same pellet (or a statistically equivalent one) at the identified region.
- Process the lift-out via FIB-SEM tomography (Protocol 1).
- Data Registration & Fusion: Use landmark-based or algorithmic registration to spatially align the FIB-SEM sub-volume within the larger CT volume, creating a multi-scale model.
- Perform quantification on both volumes and compare/validate parameters like porosity in overlapping pore size ranges.
Visualization of Methodologies
Title: Data Outputs from 3D Imaging Drive Performance Prediction
Title: Complementary Multi-Scale Analysis Workflow
The Scientist's Toolkit: Essential Research Reagent Solutions
Table 2: Key Materials & Tools for FIB-SEM/CT Catalyst Characterization
| Item | Function/Application | Example Product/Type |
|---|---|---|
| Conductive Carbon Tape & Paint | Provides electrical grounding to prevent SEM sample charging. | Ted Pella Carbon Conductive Tape; Silver Dag. |
| Platinum/Precious Metal Gas Injection System (GIS) Precursor | Deposits a protective conductive layer in-situ prior to FIB milling to preserve surface detail. | Trimethyl(methylcyclopentadienyl)platinum(IV) (Pt precursor). |
| Gallium Liquid Metal Ion Source (LMIS) | Standard source for focused ion beam for precise milling and sectioning. | Found in most commercial FIB columns (e.g., Ga+ from Thermo Fisher, Zeiss). |
| X-ray Contrast Enhancing Agents | Impregnated into porous samples to improve phase contrast in CT, especially for low-Z materials. | 1-Iodopropane, Hafnium-based HfO2 nanoparticles. |
| Image Segmentation Software | Converts grayscale 3D image stacks into binary (pore/solid) data for quantification. | Trainable Weka Segmentation (Fiji), Dragonfly Pro, Avizo. |
| Digital Volume Correlation (DVC) Software | For aligning and correlating multi-modal and multi-scale datasets (FIB-SEM with CT). | DaVis (LaVision), custom MATLAB/Python algorithms. |
| Porous Material Reference Standards | Calibrate and validate porosity, pore size, and resolution measurements. | NIST traceable glass filters, synthetic opal films with known pore geometry. |
From Sample to Data: A Step-by-Step Workflow for FIB-SEM and CT Catalyst Imaging
In the comparative study of FIB-SEM (Focused Ion Beam-Scanning Electron Microscopy) and Micro-CT (X-ray Computed Tomography) for catalyst pore network characterization, sample preparation is the critical determinant of data fidelity. FIB-SEM requires conductive, vacuum-stable samples to facilitate ion milling and high-resolution electron imaging. In contrast, Micro-CT, while non-destructive, demands samples with sufficient X-ray contrast and mechanical stability during rotation. Incorrect preparation introduces artifacts that directly skew comparative metrics like porosity, tortuosity, and pore size distribution, invalidating the core thesis findings. These protocols ensure that observed differences originate from the techniques' inherent principles, not preparation variability.
Protocol for Focused Ion Beam-Scanning Electron Microscopy (FIB-SEM)
Mounting and Stabilization
Objective: To immobilize the porous catalyst particle and infuse its pore network with a stabilizing resin to prevent collapse during milling.
- Materials: Catalyst powder, Low-viscosity epoxy resin (e.g., EpoTek 301-2FL), Conductive copper or aluminum specimen stub, Acetone or isopropanol for cleaning.
- Protocol:
- Degassing: Place catalyst sample in a desiccator for a minimum of 24 hours to remove adsorbed moisture.
- Resin Infiltration:
- Mix low-viscosity epoxy and hardener per manufacturer's instructions.
- Submerge the dried catalyst particle in the resin mixture.
- Place the container in a vacuum desiccator. Apply vacuum (≤ 1 mbar) in cycles (5 minutes on, 2 minutes off) for 30-45 minutes until gas evolution ceases. This ensures resin penetrates the nanoporous network.
- Curing: Transfer the infiltrated sample to a 60°C oven for 12-24 hours for complete polymerization.
- Mounting: Trim the resin block to expose the particle. Mount the block onto a specimen stub using a conductive silver paint or carbon tape, ensuring a robust electrical path.
Conductive Coating
Objective: To render the sample surface conductive to prevent charging artifacts during high-resolution SEM imaging.
- Materials: Sputter coater, Platinum (Pt) or Gold-Palladium (Au-Pd) target.
- Protocol:
- After mounting, place the stub in a sputter coater.
- Pump the chamber to a base pressure of ≤ 0.1 mbar.
- Apply a thin, continuous conductive coating. For high-resolution work, a 5-10 nm layer of Pt is preferred over Au-Pd due to its finer grain size.
- Critical Note: Excessive coating (>20 nm) can occlude fine pore openings at the surface, biasing pore size analysis.
FIB-SEM Experimental Workflow
Diagram 1: FIB-SEM sample prep and 3D analysis workflow.
Protocol for X-ray Computed Tomography (Micro-CT)
Mounting and Stabilization
Objective: To secure the sample without introducing motion artifacts during rotation and to select a mount that minimizes X-ray attenuation and scattering.
- Materials: Catalyst particle, Low-attenuation mounting fixtures (e.g., carbon or glass fiber rod, plastic pin vise), Cyanoacrylate adhesive (superglue) or hot melt glue, Paraffin wax (optional).
- Protocol:
- Dry Mounting: For highest resolution, attach the dry catalyst particle directly to the tip of a fine carbon fiber rod using a minimal quantity of cyanoacrylate adhesive. The adhesive footprint must be smaller than the imaging resolution.
- Encapsulation (for fragile powders): For loose catalyst powders, gently contain them within a low-density, low-attenuation polymer (e.g., polyethylene) tube or suspend them in a solidified paraffin wax matrix. This minimizes particle movement.
- Alignment: Precisely center the mounted sample on the rotary stage using optical or laser alignment tools to ensure the region of interest remains in the field of view during 360° rotation.
Contrast Enhancement (Optional)
Objective: To increase X-ray attenuation difference between the catalyst material and its pore space, improving signal-to-noise.
- Materials: Heavy element contrast agents (e.g., Iodine (I₂), Tungsten Polyoxometalates, Xenon gas).
- Protocol (Iodine Staining):
- Place dried catalyst in a sealed vial with few crystals of solid iodine.
- Heat gently to 40-60°C to sublimate iodine vapor, allowing it to adsorb onto pore surfaces.
- Treat for 2-6 hours, then cool and vent excess iodine in a fume hood. Caution: Iodine is corrosive and toxic.
Micro-CT Experimental Workflow
Diagram 2: Micro-CT sample prep and tomography workflow.
Table 1: Summary of Preparation Requirements and Outcomes for FIB-SEM vs. Micro-CT
| Parameter | FIB-SEM Protocol | Micro-CT Protocol | Impact on Thesis Comparison |
|---|---|---|---|
| Sample State | Dehydrated, Resin-infiltrated, Coated | Dry or Contrast-enhanced | Resin infiltration in FIB-SEM may slightly alter pore morphology vs. dry state in CT. Must account for this in data models. |
| Conductivity Requirement | Mandatory (Metallic coating: 5-10 nm Pt) | Not Required | Coating layer in FIB-SEM can reduce measurable pore diameter by ~10-20 nm at surface. |
| Vacuum Compatibility | Mandatory | Not Applicable | Limits FIB-SEM to stabilized samples, while CT can image wet or volatile phases in situ. |
| Inherent Destructiveness | Destructive (sequential milling) | Non-destructive | FIB-SEM provides a single, site-specific 3D volume. CT allows multi-scale analysis of the same particle. |
| Typical Resolution | 5-10 nm (voxel) | 0.5-5 µm (voxel) | Direct comparison valid only for pore sizes > CT resolution. FIB-SEM data informs sub-micron pore structure. |
| Key Preparation Artifact | Resin not fully penetrating nanopores; Curtaining effect during milling | Beam hardening; Motion blur; Low contrast for light elements | Preparation artifacts differ, requiring distinct correction algorithms before comparative pore metrics are extracted. |
The Scientist's Toolkit: Key Research Reagent Solutions
Table 2: Essential Materials for Catalyst Sample Preparation
| Item | Function & Rationale | Primary Technique |
|---|---|---|
| Low-Viscosity Epoxy (EpoTek 301-2FL) | Infiltrates nanoporous networks to provide mechanical stability during FIB milling, preventing pore collapse. | FIB-SEM |
| Platinum (Pt) Sputter Target | Provides a fine-grained, conductive coating to dissipate electron charge, enabling high-resolution SEM imaging. | FIB-SEM |
| Carbon Fiber Rods (≤100 µm diameter) | Provides near-transparent mounting support for Micro-CT, minimizing X-ray scattering and attenuation artifacts. | Micro-CT |
| Iodine (I₂) Crystals | Sublimates to provide heavy-element contrast agent for X-rays, enhancing attenuation in carbon-based catalyst materials. | Micro-CT (Optional) |
| Conductive Silver Paint | Creates a durable, low-resistance electrical path between sample stub and mounted specimen, preventing charging. | FIB-SEM |
| Precision Pin Vise | Holds and centers micron-sized samples on Micro-CT rotation stage with sub-micron positional accuracy. | Micro-CT |
Application Notes
Within a comparative thesis on FIB-SEM versus X-ray Computed Tomography (CT) for catalyst pore characterization, FIB-SEM is the unequivocal method for achieving ultra-high-resolution (<5 nm) 3D reconstruction of nanoporous networks. While CT offers non-destructive, rapid analysis of larger volumes, FIB-SEM provides the nanometer-scale fidelity required to resolve microporosity, pore connectivity, and surface morphology critical for understanding catalyst performance and deactivation mechanisms. The success of this technique hinges on the precise optimization of milling and imaging parameters, which directly determine data fidelity, volume size, and acquisition time.
Key Parameter Interdependencies
The process is a balance of competing factors:
- Slice Thickness: Dictates z-axis resolution and must be matched to the x-y imaging resolution. Thinner slices improve reconstruction accuracy but increase acquisition time and electron beam damage.
- Milling Current: Controls material removal rate and trench quality. High currents enable large volumes but induce surface damage (curtaining, redeposition); low currents yield smooth surfaces for high-quality imaging.
- Imaging Conditions: Beam energy, current, and dwell time determine signal-to-noise ratio (SNR), resolution, and sample charging. Low-kV imaging reduces beam penetration and damage, preserving surface detail.
Quantitative Parameter Tables
Table 1: Standard Milling Parameters for Catalyst Materials (e.g., Pt/Al₂O₃, Zeolites)
| Process Step | Gallium Ion Beam Current | Beam Energy | Purpose & Notes |
|---|---|---|---|
| Trench Milling | 5 - 15 nA | 30 kV | Rapid initial excavation to create imaging face. Use higher currents for larger trenches. |
| Cleaning Cross-Section | 1 - 3 nA | 30 kV | Final polish of the milled face to remove amorphous damage layer (≈50-100 nm). |
| Sequential Slice Milling | 50 - 300 pA | 30 kV | Precise, incremental material removal. Thickness defines z-resolution. Lower current for thinner slices. |
Table 2: Optimal SEM Imaging Parameters for High-Resolution Stack Acquisition
| Parameter | Typical Range for Catalysts | Impact on Image Quality & Sample |
|---|---|---|
| Beam Energy | 1.5 - 3.0 kV | Minimizes beam penetration, reduces charging, and enhances surface detail contrast. |
| Beam Current | 50 - 200 pA | Balances between sufficient signal (SNR) and spatial resolution/beam damage. |
| Dwell Time | 1 - 10 µs | Higher dwell improves SNR but increases acquisition time and potential carbon deposition. |
| Working Distance | 5 mm or less | Optimizes resolution for in-lens or through-the-lens detectors. |
| Slice Thickness | 5 - 20 nm | Must be ≥ pixel size. Thinner slices improve 3D reconstruction accuracy. |
Table 3: Comparative Analysis: FIB-SEM vs. Micro-CT for Catalyst Characterization
| Aspect | FIB-SEM | X-ray Micro-CT |
|---|---|---|
| Resolution (Spatial) | 1 - 20 nm | 0.2 - 5 µm |
| Sample Preparation | Destructive (requires cross-section) | Non-destructive (minimal prep) |
| Field of View / Volume | Limited (≈50 x 50 x 50 µm³ typical) | Large (mm³ scale) |
| Key Contrast Mechanism | Surface topography/composition (SE) | Bulk density/atomic number |
| Best For | Nanopore structure, connectivity, shell/core morphology | Macro-pore distribution, homogeneity, large particle analysis |
Detailed Experimental Protocol
Protocol: 3D Nanotomography of a Mesoporous Catalyst Pellet via FIB-SEM
Objective: To acquire a high-fidelity 3D dataset of the internal pore network of a heterogeneous catalyst (e.g., Pt/γ-Al₂O₃) for quantification of porosity, pore size distribution, and active phase dispersion.
I. Sample Preparation
- Mounting: Secure a representative catalyst pellet or fragment onto a standard SEM stub using conductive carbon tape.
- Conductive Coating: Apply a uniform, thin (5-10 nm) layer of Au/Pd or carbon via sputter coater to ensure surface conductivity and mitigate charging during FIB and SEM operations.
- Stub Transfer: Mount the stub securely in the FIB-SEM dual-beam microscope stage. Ensure proper electrical contact.
II. Site Selection & Protective Deposition
- Navigation: Using the SEM beam at low kV (5 kV), image the sample surface to identify a region of interest (ROI) free of cracks or obvious artifacts.
- E-Beam Deposition: Within the ROI, use the gas injection system (GIS) to deposit a 1 µm thick protective layer of platinum (or carbon) via electron beam-induced deposition (EBID). This protects the original surface from ion damage during initial milling.
- Ion-Beam Deposition: Use the ion beam to deposit an additional 1-2 µm thick Pt strap atop the EBID layer. This provides a robust, conductive cap for clean milling.
III. Trench Milling & Cross-Section Preparation
- Rough Trench: Using the ion beam at 30 kV, 7 nA, mill large trenches on two sides of the protective strap to create a freestanding lamella. Milling pattern: rectangular, with dimensions exceeding the desired final volume by ~5 µm on each side.
- Fine Polish: Reduce the ion beam current sequentially (3 nA, then 1 nA) to polish the vertical cross-section face, removing the ion-damaged layer and creating a smooth surface for imaging.
IV. Setting Sequential Milling & Imaging Parameters
- Slice Thickness: Set the incremental ion mill slice thickness to 10 nm (aligned with the target pixel size for isotropic voxels).
- Milling Current: Select a low, precise ion current (100 pA) for slice-by-slice milling.
- SEM Imaging Conditions:
- Alignment: Pre-tilt the stage to 0° (normal to the electron beam). Use the SEM for imaging.
- Beam Settings: Set to 2.0 kV, 100 pA. Use an immersion or in-lens detector for high-resolution secondary electron imaging.
- Scan Parameters: Set resolution to 2048 x 1536 pixels, dwell time to 3 µs, and line average to 2. Ensure the pixel size is 10 nm (e.g., for a 20 µm field of view).
- Automation: Program the automated run using the microscope's 3D slicing software. Define the total number of slices (e.g., 500 for a 5 µm volume).
V. Automated Serial Sectioning & Data Acquisition
- Initiate the automated run. The system will sequentially: (a) Mill away a 10 nm slice using the ion beam. (b) Capture a high-resolution SEM image of the freshly exposed surface.
- Monitoring: Periodically check image drift and focus. Implement automated drift correction routines if available.
- Data Storage: Save the image stack in an uncompressed format (e.g., .tif).
VI. Post-Processing & Analysis
- Image Stack Alignment: Use specialized software (e.g., Fiji/ImageJ with plugins, ORS Dragonfly, Thermo Scientific Amira) to align the image stack to correct for minor lateral drift.
- Segmentation: Apply filters (median, non-local means) to reduce noise. Use thresholding or machine learning-based tools to segment pores from the solid matrix.
- Quantification: Calculate volume porosity, pore size distribution (via granulometry or sphere-fitting), and tortuosity from the binarized 3D volume.
Visualizations
Title: FIB-SEM 3D Nanotomography Workflow for Catalysts
Title: Key Parameter Trade-Offs in FIB-SEM
The Scientist's Toolkit: Essential Research Reagents & Materials
Table 4: Key Reagents and Materials for FIB-SEM Catalyst Characterization
| Item | Function & Importance |
|---|---|
| Conductive Adhesive Tapes (Carbon, Copper) | Provides stable, electrically grounded mounting for insulating catalyst samples, preventing charging artifacts. |
| Sputter Coater with Au/Pd Target | Applies a thin, continuous conductive metal film on non-conductive samples, essential for imaging catalysts like zeolites or alumina. |
| GIS Precursors: Pt, C, W | Gaseous organometallic precursors for electron/ion beam-induced deposition (EBID/IBID) to create protective straps and conductive pads. |
| Conductive Silver Epoxy | Provides a permanent, high-conductivity bond between sample and stub for challenging geometries or long run times. |
| Precision Tweezers & Manipulators | For safe transfer and precise placement of fragile catalyst fragments onto SEM stubs. |
| Dust Remover (Canned Air/Ionizer) | Critical for cleaning stubs and samples before insertion into the microscope to prevent contamination. |
| FIB-SEM-Compatible Sample Stubs | Standardized mounts (e.g., aluminum, stainless steel) that fit the microscope stage and allow for precise eucentric height adjustment. |
| Image Analysis Software Suite (e.g., Fiji, Amira, Dragonfly) | For alignment, segmentation, and quantitative 3D analysis of the acquired image stack to extract pore metrics. |
Application Notes
Within a comparative research thesis evaluating FIB-SEM versus X-ray Computed Tomography (CT) for catalyst pore network characterization, the strategic selection of CT parameters is paramount. FIB-SEM offers superior nanometer-scale resolution but is destructive and limited in field of view. CT provides non-destructive, 3D volumetric data of entire samples (mm to cm scale) but with a fundamental resolution-contrast trade-off. Optimal parameter selection balances the need to resolve sub-micron catalyst pores with sufficient material phase contrast while maintaining feasible scan durations and minimizing beam damage.
The core parameters—source energy, voxel size, scan time, and filtering—are deeply interdependent. For porous catalyst bodies (e.g., alumina supports, zeolites, Pt/Pd nanoparticles), low X-ray energies (e.g., 40-80 kV) enhance photoelectric absorption, improving contrast between the support, active metals, and pores. However, lower energy may necessitate longer exposure times or fail to penetrate larger samples. Voxel size, determined by detector geometry and geometric magnification, must be chosen based on the smallest feature of interest (e.g., ~1/3 to 1/5 of the target pore size). Scan time per projection directly influences signal-to-noise ratio (SNR); longer times reduce noise but increase the risk of sample drift or degradation. Post-reconstruction filtering (e.g., non-local means, median filters) can mitigate noise but must be applied judiciously to avoid loss of critical pore-edge definition.
Table 1: Quantitative Parameter Interplay for Catalyst CT
| Parameter | Typical Range for Catalysts | Effect on Resolution | Effect on Contrast | Impact on Scan Time |
|---|---|---|---|---|
| Source Energy | 40 - 120 kV | Indirect: Higher energy can allow smaller focal spot. | High: Lower energy increases photoelectric contrast. | Higher energy reduces required exposure time. |
| Voxel Size | 0.5 - 5.0 µm | Direct: Defines nominal resolution limit. | Minimal direct effect. | Smaller voxels require more projections, increasing time. |
| Exposure per Projection | 0.5 - 3.0 seconds | Improves SNR, effective resolution. | Improves SNR for low-contrast features. | Direct: Linear increase with exposure. |
| Number of Projections | 1200 - 3600 | More angles reduce artifacts, improving effective resolution. | Reduces streak artifacts, improving contrast fidelity. | Direct: Linear increase with count. |
| Reconstruction Filter (e.g., Kernel) | Shepp-Logan to Parzen | Sharper filters (e.g., Ram-Lak) enhance edges but amplify noise. | Softer filters smooth noise but blur edges, reducing local contrast. | Computational cost only. |
Table 2: Protocol Comparison: High-Res vs. High-Throughput Catalyst CT
| Protocol Aim | Source Energy (kV) | Target Voxel (µm) | Projections | Scan Time Estimate | Recommended Filter |
|---|---|---|---|---|---|
| High-Resolution (Sub-µ Pores) | 50 - 60 | 0.5 - 1.0 | 2400 - 3600 | 2 - 4 hours | Non-local Means + Unsharp Mask |
| High-Throughput (Batch Screening) | 80 - 100 | 2.0 - 3.0 | 1200 - 1500 | 20 - 40 minutes | Median 3x3 + Gaussian Smoothing |
| Compromise (Balance) | 60 - 80 | 1.0 - 1.5 | 1800 - 2000 | 1 - 1.5 hours | Bilateral Filter |
Experimental Protocols
Protocol 1: High-Resolution CT for Mesoporous Catalyst Pellet
Objective: Resolve pore structures within a 1mm diameter catalyst pellet with suspected pores in the 1-10 µm range. Sample Prep: Secure pellet onto carbon fiber pin mount using low-density adhesive. Apply gentle gold sputter coating (∼10 nm) if sample charging is anticipated in lab-based CT. Instrument Setup (Lab-based Micro-CT):
- Source: Set voltage to 60 kV, current to 80 µA. Use 0.5 mm Al filter to attenuate low-energy beam hardening.
- Geometry: Position sample to achieve 1.0 µm isotropic voxel size (via geometric magnification).
- Detector: Set exposure time to 1.5 seconds per projection. Use 2x2 pixel binning only if SNR is critically low.
- Acquisition: Collect 2400 projections over 360-degree rotation. Enable 3-frame averaging per projection for noise reduction. Total scan time: ~3 hours.
- Reconstruction: Use filtered back-projection with a Parzen filter to balance noise and sharpness. Apply beam hardening correction (30% level).
- Post-Processing: Apply 3D non-local means filter (strength: 0.7, search window: 5) to reduce noise while preserving edges. Segment pores using a local adaptive thresholding algorithm (e.g., Phansalkar method).
Protocol 2: High-Throughput CT for Catalyst Batch Screening
Objective: Rapidly assess macro-pore distribution and homogeneity across multiple 3mm catalyst beads. Sample Prep: Load up to 5 beads into a low-attenuation polymer sample holder. Instrument Setup:
- Source: Set voltage to 90 kV, current to 70 µA. Use 0.25 mm Cu filter for harder, more penetrating beam.
- Geometry: Position sample for 2.5 µm isotropic voxel size.
- Detector: Set exposure time to 0.8 seconds per projection.
- Acquisition: Collect 1200 projections over 360 degrees. Disable frame averaging. Total scan time: ~16 minutes per scan.
- Reconstruction: Use filtered back-projection with a Shepp-Logan filter. Apply standard beam hardening correction.
- Post-Processing: Apply a 3D median filter (3x3x3 kernel). Use global Otsu thresholding for rapid segmentation of large pores and cracks.
Visualization
Decision Logic for CT Parameters
Multi-Scale Catalyst Analysis Workflow
The Scientist's Toolkit
Table 3: Essential Research Reagent Solutions & Materials for Catalyst CT
| Item | Function & Relevance to Catalyst CT |
|---|---|
| Carbon Fiber Sample Mounts | Low X-ray attenuation minimizes artifacts, crucial for imaging low-density catalyst supports. |
| Low-Density Adhesive (e.g., Cyanacrylate, Wax) | Secures sample without obscuring surface features or causing beam hardening shadows. |
| Gold/Palladium Sputter Coater | Applied for charge reduction in lab-based CT systems, ensuring clean signal from non-conductive catalysts. |
| Calibration Phantoms (e.g., Density, Resolution) | Essential for quantifying voxel size accuracy and validating grayscale values for material differentiation. |
| Beam Hardening Filters (Al, Cu, Sn foils) | Placed at X-ray source to preferentially absorb low-energy photons, reducing cupping artifacts in dense samples. |
| Reference Samples (e.g., Monodisperse Beads) | Used to empirically determine the Modulation Transfer Function (MTF) and measure actual system resolution. |
| 3D Image Analysis Software (e.g., Avizo, Dragonfly) | Enables segmentation, quantification, and visualization of pore networks, particle distributions, and tortuosity. |
| Polymer Sample Holders (Multi-well) | Allows for high-throughput scanning of multiple catalyst beads or fragments in a single run. |
Accurate pore network characterization is critical for understanding mass transport, active site accessibility, and performance in heterogeneous catalysts. Within a comparative thesis on Focused Ion Beam Scanning Electron Microscopy (FIB-SEM) vs. X-ray Computed Tomography (CT) for catalyst analysis, image segmentation represents the pivotal step that transforms acquired 3D grayscale images into quantifiable, binary pore-solid models. This document details application notes and protocols for two core segmentation paradigms: traditional Thresholding and advanced AI-Based Methods.
Core Segmentation Methodologies: Protocols & Application Notes
Thresholding-Based Segmentation
Protocol 2.1.1: Global Histogram-Based Thresholding (Otsu's Method)
- Objective: To automatically separate pore and solid phases from a grayscale FIB-SEM/CT slice based on image histogram.
- Materials: Reconstructed 2D grayscale image stack (8-bit or 16-bit). Image analysis software (e.g., ImageJ/Fiji, MATLAB, Python with scikit-image).
- Procedure:
- Preprocessing: Apply a non-local means or median filter (3x3 kernel) to reduce noise while preserving edges.
- Histogram Calculation: Compute the normalized intensity histogram of the preprocessed image.
- Threshold Search: Iterate over all possible intensity thresholds (t). For each t, calculate the within-class variance (σ²_w) for the two resultant classes (pores: intensities < t, solid: intensities >= t).
- Optimal Threshold Selection: Identify the threshold t that minimizes the within-class variance σ²w (or equivalently, maximizes between-class variance σ²b).
- Binarization: Create a binary mask where all pixels with intensity < t are set to 1 (pore) and pixels >= t are set to 0 (solid).
- Post-processing: Apply a binary morphological "open" operation (erosion followed by dilation) to remove isolated solid pixels within pores, followed by a "close" operation to fill isolated pore pixels within the solid.
- Application Notes: Otsu's method is optimal for bimodal histograms. Performance degrades significantly with image noise, artifacts, or intensity inhomogeneity (common in FIB-SEM due to charging or in CT due to beam hardening).
Protocol 2.1.2: Local Adaptive Thresholding
- Objective: To segment images where the optimal threshold varies spatially across the field of view.
- Procedure:
- Define a local window (e.g., 31x31 pixels) centered on each pixel.
- Within this window, calculate a local threshold (using Otsu's method or mean/median intensity minus a constant C).
- Assign the pixel as pore or solid based on this local threshold.
- Slide the window across the entire image.
- Application Notes: Superior for images with shading gradients. Computationally intensive and requires careful selection of window size (must be larger than pore size, smaller than gradient scale).
AI-Based Segmentation
Protocol 2.2.1: Training a U-Net for Semantic Segmentation
- Objective: To train a convolutional neural network (CNN) to predict a pore/solid label for each pixel in a 2D image slice.
- Materials: A curated dataset of aligned 2D grayscale images (inputs) and expert-labeled binary masks (ground truths). Computing environment with GPU (e.g., NVIDIA Tesla), Python, TensorFlow/PyTorch.
- Procedure:
- Data Preparation: Split dataset into Training (70%), Validation (15%), Test (15%) sets. Apply data augmentation (rotation, flipping, slight intensity scaling) to the training set to improve model generalization.
- Model Architecture: Implement a U-Net with an encoder (contracting path for feature extraction) and a decoder (expanding path for precise localization). Use skip connections to combine high-resolution features from the encoder with upsampled decoder features.
- Training: Use Adam optimizer with an initial learning rate of 1e-4. Employ a loss function combining Dice Loss and Binary Cross-Entropy to handle class imbalance (high solid-to-pore ratio). Train for a fixed number of epochs (e.g., 200) with early stopping if validation loss plateaus.
- Inference: Apply the trained model to new, unseen FIB-SEM or CT slices to generate probability maps. Apply a 0.5 threshold to generate the final binary segmentation.
- Application Notes: Requires significant effort to create high-quality ground truth labels. Model performance is highly dependent on training data quality and representativeness. Once trained, inference is fast and can handle noise and artifacts robustly.
Protocol 2.2.2: Leveraging Pre-trained Models and Transfer Learning
- Objective: To adapt a model pre-trained on a large, general image dataset (e.g., ImageNet) or material science images for specific catalyst porosity segmentation.
- Procedure:
- Select a pre-trained encoder (e.g., ResNet50) as the backbone for a segmentation model (e.g., DeepLabV3+, U-Net with ResNet encoder).
- Replace the final classification layer with a new decoder/head suitable for binary segmentation.
- Freeze the weights of the initial encoder layers. Train only the new decoder layers and the final part of the encoder for a few epochs.
- Unfreeze all layers and fine-tune the entire network on the catalyst dataset with a very low learning rate (e.g., 1e-5).
- Application Notes: Dramatically reduces required labeled data and training time compared to training from scratch. Particularly effective when catalyst image features are distinct from the pre-training domain.
Table 1: Quantitative Comparison of Segmentation Methods for Porosity Analysis
| Metric / Method | Global Otsu | Local Adaptive | AI-Based (U-Net) | Notes |
|---|---|---|---|---|
| Computational Speed | Very Fast | Moderate | Slow (Train) / Fast (Infer) | AI training requires GPU. |
| Required Expertise | Low | Moderate | High | AI needs ML & domain knowledge. |
| Handles Image Noise | Poor | Good | Excellent | U-Net learns noise-invariant features. |
| Handles Intensity Gradients | Very Poor | Excellent | Excellent | Adaptive & AI are spatially aware. |
| Need for Ground Truth Data | No | No | Yes (Extensive) | Major bottleneck for AI methods. |
| Result Consistency | Low | Moderate | High | AI eliminates operator bias. |
| Typical Porosity Error* | ± 5-15% | ± 3-8% | ± 1-3% | *Compared to physical porosimetry; depends on image quality. |
| Suitability for FIB-SEM | Low-Medium | Medium | High | AI excels with FIB-SEM's complex textures & artifacts. |
| Suitability for CT | Medium | Medium-High | High | AI robust to CT noise & partial volume effects. |
Visual Workflows
Segmentation Method Selection Workflow
AI Model Training and Validation Loop
The Scientist's Toolkit: Key Reagents & Materials
Table 2: Essential Research Reagent Solutions for Image Segmentation
| Item / Solution | Function / Purpose |
|---|---|
| FIB-SEM Sample Prep (Pt/Pd Coater) | Deposits a conductive metal layer on non-conductive catalyst samples to prevent charging artifacts during imaging. |
| ImageJ/Fiji with Plugins | Open-source software platform essential for basic thresholding, filtering, and macro-based batch processing of image stacks. |
| Python Stack (scikit-image, OpenCV) | Libraries providing algorithms for advanced thresholding, filtering, and morphological operations programmatically. |
| PyTorch / TensorFlow with GPU | Deep learning frameworks required for developing, training, and deploying AI-based segmentation models. |
| Labelbox or CVAT | Cloud-based and open-source tools, respectively, for efficiently annotating and creating ground truth data for AI training. |
| Avizo, Dragonfly, or MATLAB | Commercial software offering integrated, user-friendly workflows for advanced 3D segmentation and quantification from FIB-SEM/CT data. |
| Standard Reference Material (e.g., Ordered Porous Silica) | A sample with known, well-defined pore geometry used to validate and calibrate the segmentation and analysis pipeline. |
This document details application notes and protocols for the quantitative extraction of pore network parameters and 3D visualizations, critical for advanced materials characterization. The content is framed within a broader thesis research comparing Focused Ion Beam-Scanning Electron Microscopy (FIB-SEM) and X-ray Computed Tomography (CT) for the characterization of catalyst support pores. The objective is to provide a rigorous, reproducible framework for assessing which technique, or synergistic combination thereof, offers superior fidelity in capturing the complex, multi-scale porosity governing catalyst performance, reaction kinetics, and ultimately, drug development processes in pharmaceutical catalysis.
Core Principles & Technique Comparison
The choice between FIB-SEM and CT dictates the resolution, field of view, and type of quantifiable data.
Table 1: Comparative Analysis of FIB-SEM vs. CT for Pore Network Analysis
| Parameter | FIB-SEM | X-ray Micro-CT | Ideal Use Case |
|---|---|---|---|
| Resolution | 1-10 nm (typical in materials science) | 0.5-5 µm (lab-source); <50 nm (synchrotron) | FIB-SEM: Nanopores (<100 nm). CT: Macropores/Larger mesopores (>0.5 µm). |
| Field of View (3D) | ~10-50 µm per side (limited by serial sectioning) | 0.1-10 mm per side (scalable with resolution) | CT: Representative bulk statistics. FIB-SEM: High-res sub-region analysis. |
| Sample Preparation | Destructive (serial sectioning). Requires conductive coating. | Generally non-destructive. Minimal preparation. | CT: Intact sample analysis. FIB-SEM: Detailed cross-sectional analysis. |
| Key Measurable Parameters | Pore size distribution (PSD), pore connectivity, tortuosity, surface area-to-volume ratio, phase segmentation. | PSD, connectivity, tortuosity, total porosity, pore throat analysis. | Complementary. FIB-SEM provides superior nanoscale connectivity data. |
| Artifacts | Curtaining, gallium implantation, milling drift. | Beam hardening, ring artifacts, limited phase contrast for similar Z-materials. | Must be mitigated during acquisition and processing. |
| Quantitative Data Output | Voxel-based binary datasets, skeletonized networks, geometric parameter tables. | Same as FIB-SEM, but at a different scale. | Both enable PNM (Pore Network Model) extraction. |
Detailed Experimental Protocols
Protocol 3.1: FIB-SEM Tomography for Nanoscale Porosity
Aim: To acquire a 3D dataset of a porous catalyst support (e.g., γ-Al2O3, zeolite) with nanometer resolution. Materials: Catalyst pellet, conductive tape, sputter coater (Pt/Pd or Au), FIB-SEM system (e.g., Thermo Scientific Scios 2, Zeiss Crossbeam). Procedure:
- Sample Mounting & Coating: Mount a fractured or trimmed catalyst pellet on a stub using conductive carbon tape. Apply a thin (5-10 nm) conductive metal coating via sputter coater to prevent charging.
- Protective Layer Deposition: In the FIB-SEM, use the gas injection system (GIS) to deposit a 1-2 µm thick protective platinum or carbon strap over the region of interest (ROI).
- Trench Milling: Use a high-current ion beam (e.g., 30 nA, 30 kV) to mill large trenches on two sides of the ROI to create an isolated pillar and allow for secondary electron (SE) detection.
- Serial Sectioning & Imaging:
- Set the slice thickness (e.g., 10 nm), which defines the z-resolution.
- Configure the SEM imaging parameters (e.g., 2 kV, 50 pA, Through-the-Lens Detector (TLD)).
- Automate the cycle: a) Mill a thin slice with the FIB (e.g., 1 nA). b) Scan the newly exposed cross-section with the SEM. c) Repeat for 500-1000 slices.
- Data Output: A stack of aligned 2D grayscale images (TIFF format).
Protocol 3.2: X-ray Micro-CT for Bulk Pore Architecture
Aim: To obtain a 3D reconstruction of the bulk pore network in a catalyst pellet non-destructively. Materials: Catalyst pellet, mounting wax or clay, micro-CT system (e.g., Zeiss Xradia 620, Bruker Skyscan). Procedure:
- Sample Mounting: Securely mount the pellet on a stylet or stage using a low-density adhesive/wax to minimize artifacts. Ensure it is centered and stable.
- Acquisition Setup:
- Set voltage and current (e.g., 80 kV, 88 µA for Al2O₃) to optimize contrast.
- Apply a 0.5 mm aluminum filter to reduce beam hardening.
- Set exposure time (e.g., 2s per projection), rotation step (e.g., 0.1° over 360°), and pixel binning to achieve desired resolution and signal-to-noise ratio.
- Scan & Reconstruction: Perform the rotational scan. Reconstruct projections into a 3D tomogram using filtered back-projection or iterative algorithms (e.g., Nikon CT Pro, Thermo Scientific Amira-Avizo). Apply beam hardening and ring artifact correction during reconstruction.
- Data Output: A 3D 16-bit grayscale volume (e.g., .raw, .tiff stack).
Protocol 3.3: Universal Image Processing & Pore Network Extraction
Aim: To convert 3D grayscale data into a quantitative pore network model. Software: ImageJ/Fiji, Thermo Scientific Amira-Avizo, FEI Avizo, ORS Dragonfly, Simpleware ScanIP, custom MATLAB/Python scripts. Procedure:
- Pre-processing: Apply non-local means or median filtering to reduce noise. Correct for drift/sample movement (for FIB-SEM).
- Segmentation (Critical Step):
- Global Thresholding: Use Otsu's method for bi-modal histograms.
- Local Adaptive Thresholding: For varying intensities.
- Advanced: Machine learning (e.g., Trainable Weka Segmentation in Fiji, U-Net) or watershed separation for touching pores.
- Output: A binary volume where pore voxels = 1 and solid matrix = 0.
- Parameter Quantification (Directly from Binary Volume):
- Total Porosity: (Pore Voxels / Total Voxels) * 100%.
- Pore Size Distribution (PSD): Apply a Euclidean distance transform to the pore space, then calculate the maximal inscribed sphere radius for each voxel. Histogram the results.
- Specific Surface Area: Calculate the isosurface area (e.g., using marching cubes) and divide by total volume.
- Pore Network Model (PNM) Extraction:
- Use a skeletonization algorithm (e.g., medial axis thinning) on the pore space binary to obtain a 1-voxel-wide skeleton.
- Analyze the skeleton to identify pore bodies (nodes/junctions) and pore throats (connections/edges).
- Fit maximal inscribed spheres to each node and edge to assign volumes and radii.
- Derived Parameters from PNM:
- Connectivity: Average number of throats per pore body.
- Tortuosity: Average geodesic path length through the network divided by Euclidean distance.
- Coordination Number Distribution.
Table 2: Key Quantitative Parameters from Pore Network Analysis
| Parameter | Symbol/Unit | Calculation Method | Physical Significance |
|---|---|---|---|
| Total Porosity | ε (%) | Vpores / Vtotal * 100 | Total void fraction available for fluid/gas transport. |
| Pore Diameter | d (nm, µm) | Equivalent sphere diameter or local thickness. | Governs Knudsen vs. bulk diffusion, capillary pressure. |
| Specific Surface Area | S_v (µm⁻¹) | Apore / Vtotal | Catalytic activity potential (active site density). |
| Pore Connectivity | - | Avg. throats per node. | Defines percolation pathways and accessibility. |
| Tortuosity | τ | Leff / Lstraight | Resistance to diffusion/mass transfer. |
| Pore Throat Size Distribution | d_th (nm, µm) | Hydraulic radius of connecting channels. | Rate-limiting step for transport. |
Workflow Visualization
Pore Analysis Workflow Decision Tree
The Scientist's Toolkit: Essential Research Reagents & Materials
Table 3: Key Research Reagent Solutions & Materials
| Item | Function/Brief Explanation |
|---|---|
| Conductive Carbon Tape | Provides electrical grounding for SEM imaging, preventing sample charging. |
| Platinum/Palladium/Gold Target | For sputter coater; deposits thin conductive layer on non-conductive samples (e.g., catalysts). |
| GIS Precursors (e.g., Pt, C) | For in-situ FIB deposition of protective layers to preserve surface topology during milling. |
| Mounting Waxes (e.g., Crystalbond) | For securing samples to CT stages without introducing imaging artifacts. |
| Aluminum/Copper Filters | Used in CT to filter low-energy X-rays, reducing beam hardening artifacts. |
| Image Segmentation Software (Amira-Avizo, Dragonfly) | Commercial platforms with dedicated modules for 3D material segmentation and PNM extraction. |
| Open-Source Tools (ImageJ/Fiji, 3D Slicer, PoreSpy) | Critical for pre-processing, filtering, and basic quantitative analysis. |
| Python/Matplotlib & Paraview | For custom analysis scripting and high-quality 3D scientific rendering. |
Overcoming Imaging Challenges: Expert Tips for Optimizing FIB-SEM and CT Data Quality
This Application Note, contextualized within a broader thesis comparing FIB-SEM and X-ray Computed Tomography (CT) for catalyst pore characterization, details critical artifacts inherent to Focused Ion Beam Scanning Electron Microscopy (FIB-SEM). For catalyst research, where nano-scale pore architecture dictates performance, artifacts like curtaining, redeposition, and ion beam damage can severely distort porosity, connectivity, and surface area measurements. Mitigating these artifacts is essential for generating data comparable to non-destructive CT techniques.
Key Artifacts: Mechanisms and Impact on Catalyst Characterization
Curtaining: Vertical stripes caused by differential milling rates due to heterogeneous material composition (common in catalysts with mixed metal/support phases). This obscures true pore morphology and introduces measurement errors in pore dimensions.
Redeposition: Sputtered material re-adheres to freshly milled surfaces, blocking pore entrances and reducing apparent porosity and connectivity—a critical error for diffusion studies.
Ion Beam Damage: Amorphization, implantation, and compound formation (e.g., Ga⁺ in catalysts) alter surface chemistry and structure up to tens of nanometers deep, affecting subsequent analysis like EDX.
Table 1: Quantitative Impact of Artifacts on Catalyst Pore Metrics
| Artifact | Typical Scale | Primary Effect on Pores | Measured Porosity Error Range |
|---|---|---|---|
| Curtaining | Stripe depth: 50-300 nm | Elongation, false anisotropy, wall obscuration | 5-25% (local) |
| Redeposition | Layer thickness: 20-100 nm | Pore occlusion, throat blockage | 10-40% reduction |
| Ion Beam Damage | Amorphous layer: 10-30 nm | Surface roughening, pseudo-porosity | ±5-15% (surface) |
| End-of-trench artifact | Taper: 1-5° | Pore geometry distortion | 2-10% (gradient) |
Experimental Protocols for Artifact Mitigation
Protocol 3.1: Minimizing Curtaining in Heterogeneous Catalysts
- Objective: Produce a uniform cross-section in a catalyst pellet (e.g., Pt/Al₂O₃).
- Materials: FIB-SEM system, electron-transparent silicon or platinum deposition gas injector, conductive epoxy.
- Procedure:
- Conductive Coating: Infiltrate catalyst pellet with conductive epoxy to reduce charging.
- Protective Cap Deposition: Use electron-beam-induced deposition (EBID) of a 1-2 µm Pt layer over the region of interest (ROI) at 5 kV, 0.5 nA.
- Trench Milling: Use a high-current ion beam (e.g., 30 kV, 15 nA) to mill coarse trenches >5 µm away from the ROI.
- Final Polish: Use a progressive current reduction series (7 nA -> 3 nA -> 1 nA -> 300 pA) for the final cross-section, with the stage tilted to 52° (for a 90° final wall).
- Cleaning Cross-Section: Use a low-energy (5 kV, 50 pA) ion beam at a glancing angle (<10°) to remove redeposited material.
Protocol 3.2: Gas-Assisted Etching to Reduce Redeposition
- Objective: Mill high-aspect-ratio pores in a zeolite catalyst without pore-filling.
- Materials: FIB-SEM with gas injection system (GIS), XeF₂ or I₂ etching gas.
- Procedure:
- GIS Setup: Insert the halogen-based (XeF₂) GIS needle, calibrated to a working distance of ~100 µm from the sample.
- Local Gas Injection: Open the GIS valve to create a local gas pressure of ~5 x 10⁻⁵ mBar in the chamber.
- Assisted Milling: Simultaneously scan the Ga⁺ beam (30 kV, 1 nA) over the ROI. The gas reacts with the sputtered material to form volatile products.
- Purge Cycle: After milling for 30 seconds, close the GIS valve and allow the chamber to purge for 15 seconds to remove reaction byproducts.
- Iterative Milling: Repeat steps 2-4 until the desired depth is achieved, then perform a final low-current polish.
Protocol 3.3: Low-Energy Polishing for Ion Beam Damage Reduction
- Objective: Prepare a TEM lamella from a metal-organic framework (MOF) catalyst with minimal amorphous damage.
- Procedure:
- Initial Lift-Out: Perform standard lift-out at 30 kV, using the lowest currents possible for cutting (100 pA for final cuts).
- Thinning: Thin the lamella to ~1 µm using a 30 kV, 50 pA beam.
- Low-Energy Final Polish: Reduce the ion beam acceleration voltage to 5 kV or 2 kV. Polish the lamella at a very low current (10-30 pA) until electron transparency is achieved.
- Verification: Image the lamella at 5 kV in the SEM to check for conductivity and surface quality before TEM insertion.
Title: FIB-SEM Catalyst Prep and Artifact Mitigation Workflow
Title: FIB Artifacts: Cause, Impact on Catalysts, and Mitigation
The Scientist's Toolkit: Key Reagents & Materials
Table 2: Essential Research Reagent Solutions for FIB-SEM Catalyst Preparation
| Material/Reagent | Primary Function | Application Note |
|---|---|---|
| Conductive Epoxy (e.g., Ag-filled) | Renders porous catalyst electrically conductive, reducing charging artifacts. | Critical for insulating supports (SiO₂, Al₂O₃). Use vacuum infiltration. |
| Organometallic GIS Precursors (Pt, W) | Electron/ion-beam induced deposition of protective caps and conductive straps. | E-beam deposition causes less damage. Use before heavy ion milling. |
| Halogen Etch Gases (XeF₂, I₂) | Forms volatile compounds with sputtered sample material, reducing redeposition. | XeF₂ is highly reactive; use with proper gas handling systems. Ideal for porous materials. |
| Low-Vapor Pressure Lubricants | Applied ex situ to reduce curtaining in ultra-soft materials (e.g., some polymers). | Controversial; may contaminate pores. Use only when essential and document. |
| Micromanipulator Needles & Grids | For lift-out and mounting TEM lamellae. | Use carbon-coated Cu grids for EDS analysis to avoid Cu peaks. |
| FIB-SEM-Compatible Stubs | Sample mounting with high conductivity and stability. | Use carbon tape or silver paste for maximum grounding of catalyst particles. |
Comparative Context: FIB-SEM vs. X-ray CT for Catalysts
Table 3: Strategic Selection Guide: FIB-SEM vs. X-ray CT for Pore Analysis
| Criterion | FIB-SEM | X-ray CT (Lab/ Synchrotron) |
|---|---|---|
| Resolution | 1-10 nm (practical, 3D) | 50-500 nm (lab), <50 nm (synchrotron) |
| Field of View | Limited (~50 µm³) | Large (mm³ to cm³) |
| Destructive? | Yes (sectioning) | No |
| Key Artifacts | Curtaining, Redeposition, Ion Damage | Beam Hardening, Ring Artifacts, Scattering |
| Pore Connectivity | Inferable, but prone to redeposition error | Directly measured non-destructively |
| Best For | Nanopores (<50 nm), local heterogeneity, high-res surface detail | Macro/Mesopores (>50 nm), large-scale gradients, dynamic in situ studies |
| Throughput | Low (days per volume) | Medium to High (hours per scan) |
Conclusion: For comprehensive catalyst pore characterization, a correlative approach is optimal. X-ray CT identifies representative regions of interest across large volumes. Targeted FIB-SEM, employing the mitigation protocols above, then provides ultra-high-resolution 3D data of local nanopore networks, provided artifacts are rigorously controlled to yield valid quantitative data.
In the comparative analysis of FIB-SEM and Micro-CT for catalyst pore network characterization, CT scanning offers the critical advantage of non-destructive, 3D volumetric imaging. However, its quantitative accuracy for pore size distribution, connectivity, and tortuosity is severely compromised by artifacts and noise. This document provides application notes and protocols for mitigating three dominant CT artifacts—Beam Hardening, Ring Artifacts, and Noise—to ensure data fidelity competitive with FIB-SEM’s high-resolution cross-sections for porous catalyst research.
Artifact & Noise Fundamentals: Impact on Catalyst Metrics
| Artifact/Noise Type | Primary Cause | Effect on Catalyst Pore Data | Key Quantitative Metric Impacted |
|---|---|---|---|
| Beam Hardening | Polychromatic X-ray spectrum; lower-energy photons preferentially absorbed. | Cupping artifacts, streaking, false density gradients. Distorts pore wall edges, affects segmentation. | Pore volume fraction, wall thickness distribution, local density measurements. |
| Ring Artifacts | Non-uniform response or miscalibration of detector elements. | Concentric rings centered on rotation axis. Obscures radial pore connectivity, creates false circular features. | Radial porosity profile, pore connectivity (number of isolated pores). |
| Quantum Noise | Stochastic nature of X-ray photon detection. | Grainy "salt-and-pepper" texture. Increases segmentation error, obscures small (< voxel size) features. | Surface area-to-volume ratio, detection of micropores, tortuosity calculations. |
Detailed Experimental Protocols for Mitigation
Protocol 3.1: Combined Hardware & Software Beam Hardening Correction
Objective: To obtain a linear relationship between material thickness and measured attenuation for accurate catalyst density mapping. Materials: Micro-CT scanner with adjustable keV source, physical filters (e.g., Aluminum, Copper), catalyst pellet sample, calibration phantoms (known materials). Procedure:
- Pre-Filtering: Place a 0.5-2.0 mm Aluminum filter at the X-ray source port. This "hardens" the beam by pre-absorbing low-energy photons.
- Energy Selection: If using a lab-based source, set voltage (kVp) to the highest practical setting (e.g., 100-140 kVp for dense catalysts) to increase mean beam energy.
- Calibration Scan: Image a step-wedge phantom of known materials (e.g., AI, Cu, polymer) under identical settings. Establish a non-linear correction curve.
- Sample Scan: Acquire projections of the catalyst sample.
- Software Correction: Apply a post-reconstruction polynomial correction or a proprietary iterative algorithm (e.g., based on the work of Joseph & Spital). Validate by checking for the removal of cupping in a homogeneous region of the catalyst support.
Protocol 3.2: Ring Artifact Reduction via Detector Calibration & Post-Processing
Objective: To eliminate concentric ring patterns without blurring genuine radial pore structures. Materials: CT scanner with flat-field correction capability, uniform cylindrical reference sample (e.g., water, Lucite). Procedure:
- Flat-Field Calibration: Prior to sample scanning, acquire a set of flat-field images (beam on, no sample) and dark-field images (beam off) at multiple angles. Average each set.
- Normalization: For each projection during sample acquisition, apply:
Corrected = (Raw - Dark) / (Flat - Dark). - Post-Reprocessing (if rings persist):
- Apply a stripe removal algorithm (e.g., wavelet-Fourier filtering) to the sinogram (raw projection data).
- Critical Parameter: Set the filter direction to be perpendicular to the ring orientation in the sinogram (usually vertical) to avoid removing real vertical sample features.
- Validation: Inspect a uniform region of the reconstructed volume. The standard deviation of voxel values in this region should be minimized post-correction.
Protocol 3.3: Noise Reduction for Pore Boundary Clarity
Objective: To suppress quantum noise while preserving the sharp interface between pore and solid phase for accurate segmentation. Materials: High-performance computing node for iterative reconstruction. Procedure:
- Acquisition Optimization: Maximize photon count. Use the longest exposure time tolerable, highest tube current, and binning compatible with resolution requirements.
- Iterative Reconstruction: Instead of standard Filtered Back Projection (FBP), use an iterative method (e.g., SIRT, MBIR).
- Parameters: Set 50-200 iterations with a positivity constraint.
- Regularization: Apply a Total Variation (TV) minimization prior to edge preservation. Weighting parameter (
lambda) must be tuned: start at 0.1 and adjust.
- Post-Reconstruction Filtering (if required): Apply a 3D non-local means or anisotropic diffusion filter with a small kernel size. Avoid Gaussian blurring.
- Segmentation Validation: Compare the segmented porosity from the processed scan against a porosity measurement from gas physisorption (BET) for the same catalyst batch.
Visualization of Workflows
Diagram Title: CT Data Processing Workflow for Catalyst Analysis
Diagram Title: Artifact Impact on Catalyst Pore Characterization
The Scientist's Toolkit: Key Research Reagent Solutions
| Item / Reagent | Function in CT Optimization for Catalysts |
|---|---|
| Aluminum & Copper Sheet Filters | Pre-hardens the X-ray beam to reduce beam hardening artifacts in dense samples. |
| Calibration Phantoms (Step-Wedge, Homogeneous Spheres) | Provides known density references for quantitative grayscale correction and ring artifact assessment. |
| Uniform Reference Cylinder (e.g., Lucite, Water) | Essential for performing daily flat-field calibration to prevent ring artifacts. |
| Iterative Reconstruction Software (e.g., Astra Toolbox, Avizo) | Enables model-based noise reduction while preserving edges critical for pore boundaries. |
| Total Variation Regularization Algorithm | A specific mathematical prior used in iterative reconstruction to smooth noise without blurring edges. |
| High-Purity Silicon or Aluminum Rod | Used as a sample holder; its known, uniform structure helps identify scanner-induced ring artifacts. |
| Gold Nanoparticle Tracer Suspension | Can be infused into catalyst pores; high attenuation aids in distinguishing noise from true microporosity. |
In the comparative thesis on FIB-SEM versus X-ray Computed Tomography (CT) for characterizing nanoporous catalyst architectures, a central challenge is the inherent low electron and X-ray attenuation contrast of many catalyst supports (e.g., alumina, silica, porous carbons) and active phases (e.g., metal nanoparticles). This document details application notes and protocols for enhancing contrast, a prerequisite for accurate 3D segmentation and pore network analysis, which directly influences the evaluation of each technique's efficacy for quantitative pore characterization.
Application Notes: Contrast Enhancement Strategies
1.1. Staining for Electron Microscopy (FIB-SEM) Staining introduces high-atomic-number (Z) elements to selectively bind to specific material phases, increasing secondary electron yield and backscattered electron contrast.
- Principle: Heavy metal stains (e.g., Osmium, Ruthenium, Iodine) react with or adsorb to organic/inorganic surfaces, providing localized Z-contrast.
- Application to Catalysts: Staining can target residual carbon templates, polymer binders, or specific functional groups on support surfaces, delineating pores otherwise invisible.
1.2. Phase-Contrast Enhancements for X-ray CT Phase-contrast techniques exploit the refraction of X-rays at material interfaces, which is more sensitive than absorption for low-Z materials.
- Principle: As X-rays pass through an object, both attenuation and phase shift occur. Phase-retrieval algorithms can convert phase shifts into intensity variations, dramatically enhancing edge detection.
- Application to Catalysts: Enables visualization of fine pore boundaries and low-density phases within catalyst particles, improving the fidelity of pore segmentation in CT data.
Table 1: Quantitative Comparison of Contrast Enhancement Impact on Pore Characterization Metrics
| Characterization Metric | FIB-SEM (Unstained) | FIB-SEM (RuO4 Stained) | CT (Absorption Only) | CT (Phase-Contrast Enhanced) |
|---|---|---|---|---|
| Measured Avg. Pore Diameter (nm) | 28 ± 12 | 34 ± 9 | 45 ± 18 | 38 ± 11 |
| Detected Porosity (%) | 15 | 22 | 18 | 24 |
| Surface Area (m²/g) from 3D Data | 110 | 165 | 95 | 155 |
| Interface Sharpness (Edge SNR) | Low (1.5) | High (8.2) | Very Low (1.1) | High (6.7) |
| Key Artifact | Over-segmentation due to noise | Clear phase boundary | Volume averaging blur | Minor phase-retrieval halo |
Experimental Protocols
Protocol 2.1: Ruthenium Tetroxide (RuO4) Vapor Staining for Catalyst Supports
- Objective: To enhance contrast of carbonaceous phases and pore surfaces in mesoporous catalysts for FIB-SEM tomography.
- Materials: See "The Scientist's Toolkit" below.
- Procedure:
- Sample Preparation: Place a dry catalyst pellet or powder on a glass slide within a sealed, chemically resistant desiccator.
- Stain Introduction: In a fume hood, place 1-2 drops of aqueous RuO4 solution (0.5% w/v) in a small vial inside the desiccator. Do not let the sample contact the liquid.
- Staining Reaction: Evacuate the desiccator gently for 30 seconds and seal. Allow staining to proceed for 30-60 minutes at room temperature.
- Quenching & Venting: Carefully vent the desiccator in the fume hood. Remove the sample and allow it to off-gas for 24 hours in a dedicated fume hood vial before SEM insertion.
- Safety Note: RuO4 is highly toxic, volatile, and a strong oxidizer. Use appropriate PPE, engineering controls, and waste procedures.
Protocol 2.2: Single-Distance Phase-Retrieval for Lab-Based Micro-CT
- Objective: To apply phase-contrast enhancement to CT projections of low-absorption catalyst particles prior to 3D reconstruction.
- Materials: Micro-CT scanner, flat-field correction images, sample stage, phase-retrieval software (e.g., Paganin-type algorithm).
- Procedure:
- Data Acquisition: Collect standard absorption-based CT projections (e.g., 1800 over 360°). Include flat-field and dark-field images.
- Parameter Determination: Estimate the sample's complex refractive index: n = 1 - δ + iβ. The ratio δ/β is critical. For porous alumina catalysts, a starting δ/β value of 50-100 is typical. This can be refined empirically.
- Algorithm Application: Apply a single-distance phase-retrieval filter (e.g., Paganin) to each projection image using the determined δ/β value and the propagation distance (sample-detector distance).
- Reconstruction: Reconstruct the 3D volume from the filtered phase-contrast enhanced projections using standard algorithms (e.g., filtered backprojection).
- Validation: Compare porosity measurements with stained FIB-SEM data from an equivalent sample region.
Visualization Diagrams
Diagram Title: Contrast Enhancement Workflow for Pore Characterization
Diagram Title: RuO4 Staining Mechanism for FIB-SEM Contrast
The Scientist's Toolkit: Research Reagent Solutions
| Item / Reagent | Function & Application |
|---|---|
| Ruthenium Tetroxide (RuO4) | High-Z vapor stain for carbonaceous materials. Selectively deposits RuO2, enhancing BSE contrast for FIB-SEM. |
| Osmium Tetroxide (OsO4) | Classic lipid & polymer stain for EM. Useful for imaging polymeric templates in catalysts. Extreme toxicity requires stringent protocols. |
| Iodine (I2) Vapor | Less aggressive alternative for staining organic phases. Suitable for some metal-organic frameworks (MOFs). |
| Tungsten Hexacarbonyl (W(CO)6) | Gas-phase precursor for Electron Beam Induced Deposition (EBID). Used for in-situ protection or contrast during FIB milling. |
| Phase-Retrieval Software (e.g., Paganin Filter) | Algorithmic tool to convert X-ray phase shifts into intensity data, crucial for enhancing CT contrast of low-Z materials. |
| Hydrated Aluminum Chloride (AlCl3·6H2O) | Reference material for calibrating X-ray attenuation/phase contrast in CT, due to known, stable density and composition. |
In the broader thesis comparing Focused Ion Beam-Scanning Electron Microscopy (FIB-SEM) and X-ray Computed Tomography (CT) for catalyst pore characterization, the fundamental challenge is the inverse relationship between spatial resolution and analyzed volume. High-resolution techniques like FIB-SEM resolve nanoscale pores crucial for catalytic activity but sample minute volumes, risking non-representative data. Lower-resolution techniques like CT scan larger, more representative volumes but may miss critical fine-scale porosity. This application note details protocols and strategies for defining a Representative Volume Element (RVE)—the smallest volume whose properties accurately reflect the whole—within this trade-off.
Quantitative Comparison of FIB-SEM vs. CT
Table 1: Resolution vs. Volume Trade-off in Pore Characterization Techniques
| Technique | Typical Spatial Resolution | Typical Maximum Volume Analyzed (µm³) | Key Strengths for Catalysts | Primary Limitation for RVE |
|---|---|---|---|---|
| Lab-Source Micro-CT | 0.5 - 5 µm | 10⁹ - 10¹² (cm³ scale) | Non-destructive, large bulk analysis, 3D pore network. | Insufficient resolution for meso/micropores (<2 nm). |
| Synchrotron Nano-CT | 50 - 200 nm | 10⁶ - 10⁹ | High flux, phase contrast, faster than lab CT. | Limited access, sample size constraints. |
| FIB-SEM Tomography | 5 - 20 nm | 10³ - 10⁶ (≈ 50x50x50 µm³) | Excellent resolution for nanopores, material contrast. | Destructive, small volume, potential curtaining artifacts. |
| Helium Ion Microscopy | 0.5 - 2 nm | ~10² (surface) | Ultimate top-down resolution. | Very limited volume, primarily surface. |
Experimental Protocols for RVE Determination
Protocol A: Multi-Scale RVE Validation Workflow Objective: To determine if a FIB-SEM volume is representative of a heterogeneous catalyst pellet.
- Macro-CT Scan: Place entire catalyst pellet (e.g., ~1mm diameter) in a lab-source micro-CT. Acquire data at ~1 µm³ voxel size.
- Reconstruction & Segmentation: Reconstruct 3D volume. Apply global thresholding to segment large pores and macro-crack network.
- Homogeneity Analysis: Use the macro-CT data to calculate porosity distribution in successive sub-volumes. Identify a region of "bulk" material away from major cracks.
- Targeted FIB-SEM Extraction: Using a micro-manipulator, lift-out a site-specific TEM lamella or a pillar (≈15x15x10 µm³) from the identified "bulk" region in the pellet.
- FIB-SEM Tomography: Perform sequential slice-and-view imaging at 10 nm pixel resolution. Align and stack images to create a 3D dataset.
- Data Registration & Comparison: Spatially register the FIB-SEM sub-volume within the macro-CT volume. Compare the porosity and pore size distribution from the FIB-SEM sub-volume to the local properties derived from the CT data at that location.
- Statistical Convergence: Calculate key metrics (porosity, specific surface area) as a function of increasing sub-volume size within the FIB-SEM dataset. The RVE size is reached when these metrics plateau within an acceptable variance (e.g., <2%).
Protocol B: Direct Pore Network Comparison for Transport Objective: To compare effective diffusivity predictions from CT and FIB-SEM datasets.
- Dual-Beam FIB-SEM Acquisition: Acquire a high-resolution (10 nm/voxel) FIB-SEM tomography dataset of a catalyst particle fragment.
- Synchrotron Nano-CT Acquisition: Image a larger fragment of the same catalyst batch at 50 nm/voxel using phase-contrast synchrotron CT.
- Segmentation & Skeletonization: Segment both datasets using advanced algorithms (e.g., trainable WEKA segmentation in Fiji). Convert the binary pore images into skeletonized networks.
- Network Extraction: Extract pore network models (PNM) detailing throat radii, pore volumes, and connectivity.
- Upscaling Simulation: Use the PNM from both datasets to simulate effective diffusivity for a model species (e.g., H₂). Perform the simulation on progressively larger sub-samples of the FIB-SEM data.
- RVE Criterion: The RVE size for transport is defined when the FIB-SEM-derived diffusivity converges to the value predicted by the larger, lower-resolution nano-CT model.
Strategic Diagrams
Title: Multi-Scale Workflow for RVE Determination
Title: Resolution-Volume Trade-off and RVE Strategy
The Scientist's Toolkit: Research Reagent Solutions
Table 2: Essential Materials for Multi-Scale Catalyst Tomography
| Item | Function in RVE Analysis | Example Product/Note |
|---|---|---|
| Conductive Epoxy | Secures catalyst particle for FIB-SEM, prevents charging. | CircuitWorks Conductive Epoxy. |
| Precursor Gas (Pt, C) | For in-situ deposition of protective layers and conductive straps on insulating catalysts prior to FIB milling. | (CH₃)₃CH₃C₅H₅Pt (Pt precursor). |
| Micromanipulator & Needle | For precise lift-out of site-specific TEM lamella or pillars from a CT-identified region. | OmniProbe or Kleindiek manipulator. |
| FIB-SEM Compatible Stub | Holds the lift-out sample for sequential slicing; must be precisely mounted. | 3D tomography stub with grid. |
| Image Stack Aligners | Software to correct drift & misalignment in sequential FIB-SEM slices. | Fiji/ImageJ Plugins: "Linear Stack Alignment with SIFT". |
| Advanced Segmentation Software | Accurately segment pores from solid in noisy or low-contrast greyscale images. | Dragonfly Pro, Avizo, or Fiji Trainable WEKA Segmentation. |
| Pore Network Modeling (PNM) Software | Extract skeletal network and simulate transport properties from 3D image data. | Open-source: PoreSpy; Commercial: GeoDict, Simpleware. |
This application note details advanced imaging protocols for sensitive catalyst materials, positioned within a broader thesis comparing Focused Ion Beam-Scanning Electron Microscopy (FIB-SEM) and Computed Tomography (CT) for catalyst pore characterization. The degradation of nanoporous architectures under electron beams and ambient conditions necessitates in-situ and cryogenic methodologies to preserve native structure and obtain accurate 3D pore network data critical for performance analysis in catalysis and related fields.
Key Challenges in Catalyst Imaging
Sensitive materials, such as metal-organic frameworks (MOFs), zeolites, supported metal nanoparticles, and carbon-based catalysts, are prone to electron beam damage, dehydration, and structural collapse under vacuum and incident energy. This compromises the fidelity of pore size distribution, connectivity, and active site localization data.
Quantitative Comparison of Imaging Modalities
Table 1: Core Comparison of FIB-SEM, Micro-CT, and Advanced Protocols for Catalysts
| Parameter | Conventional FIB-SEM | Conventional Micro-CT | In-situ Gas/Liquid FIB-SEM | Cryogenic FIB-SEM | Remarks |
|---|---|---|---|---|---|
| Resolution | 1-5 nm (XY), 10-30 nm (Z) | 0.2-5 µm | 5-10 nm (XY), 20-50 nm (Z) | 2-5 nm (XY), 10-25 nm (Z) | Cryo-FIB approaches conventional resolution. |
| Field of View | 10-50 µm | 0.5-10 mm | 10-30 µm | 10-30 µm | CT excels for macro-scale heterogeneity. |
| Sample Environment | High Vacuum | Ambient or Controlled Gas | Controlled Gas/Liquid (e.g., H₂, O₂, H₂O) | High Vacuum at < -150°C | In-situ allows real-time reaction observation. |
| Primary Artifact | Beam damage, Ga⁺ implantation, shrinkage | Scattering, low contrast for light elements | Reduced beam damage, but lower resolution | Suppresses volatilization, preserves hydrated states | Cryo fixes mobile species. |
| 3D Reconstruction Time | High (serial sectioning) | Low (single scan) | Very High | High | Time includes protocol setup (e.g., cryo-transfer). |
| Applicability to Thesis | Gold standard but may alter sensitive materials; benchmark for pore metrics. | Non-destructive, bulk statistics; limited by resolution for micropores (<2nm). | Provides "operando" pore structure data under conditions. | Preserves true native pore structure for sensitive materials. | Combined data validates CT models against high-res truth. |
Detailed Experimental Protocols
Protocol 1: Cryogenic FIB-SEM for Metal-Organic Frameworks (MOFs)
Objective: To preserve the hydrated state and prevent pore collapse during 3D pore structure characterization.
Materials & Reagents:
- Sensitive MOF catalyst pellet (< 2mm diameter)
- Cryogenic plunge freezer (e.g., Leica EM GP)
- Slushed nitrogen or ethane bath
- Cryo SEM transfer shuttle and holder
- FIB-SEM with cryo-stage (< -150°C)
- Conductive coating media (e.g., platinum sputter coating)
- Cryo-compatible adhesives
Procedure:
- Rapid Cryo-fixation: Using tweezers, rapidly plunge the MOF sample into a slushed nitrogen or ethane bath held at -210°C. Hold for 30 seconds to vitrify any residual solvent.
- Transfer: Under liquid nitrogen, mount the frozen sample onto a pre-cooled cryo SEM shuttle. Maintain sample below -180°C at all times.
- Loading: Insert the shuttle into the cryo-transfer system and load into the FIB-SEM cryo-stage. Confirm stage temperature is stable at -150°C to -170°C.
- Cryo-Coating: Sputter-coat the sample surface with a thin (5-10 nm) layer of platinum within the prep chamber to ensure conductivity.
- Cryo-FIB-SEM Operation:
- Use a lower acceleration voltage (2-5 kV) for initial SEM imaging to locate the region of interest (ROI).
- For FIB milling, use a reduced current (e.g., 1 nA initially for rough cross-section, stepped down to 100 pA or 30 pA for final polish) to minimize localized heating.
- Set the FIB slice thickness to 10 nm. Acquire the backscattered electron image after each milling step.
- Perform the serial sectioning until a volume of at least 10 µm x 10 µm x 10 µm is captured.
- Data Acquisition: Automate the "slice-and-view" sequence, ensuring stage and focus stability. Store all images in an uncompressed format.
Data Analysis: Use 3D reconstruction software (e.g., Avizo, Dragonfly) to align image stacks, segment pores vs. framework, and calculate pore size distribution, tortuosity, and connectivity metrics.
Protocol 2:In-situGas-Phase FIB-SEM for Supported Metal Catalysts
Objective: To observe pore structure and active site morphology under reactive gas environments (e.g., reduction, oxidation).
Materials & Reagents:
- Pt/Al₂O₃ catalyst bead
- In-situ FIB-SEM holder with gas injection system (GIS)
- Ultra-high purity gases (e.g., 5% H₂/Ar, 5% O₂/He)
- Mass flow controllers
- Heated holder adapter (optional)
Procedure:
- Sample Preparation: Mount the catalyst bead on a standard SEM stub using conductive carbon tape. Sputter-coat a thin carbon layer if needed, avoiding complete pore masking.
- System Setup: Load the sample into the in-situ holder. Connect the gas lines (H₂/Ar and O₂/He) to the GIS.
- Baseline Imaging: Pump the chamber to high vacuum (< 5 x 10⁻⁵ mBar). Acquire secondary electron (SE) and backscattered electron (BSE) images of the ROI at 5 kV.
- Gas Introduction: Isolate the main chamber pump. Introduce the reactive gas mixture (e.g., 5% H₂/Ar) at a controlled pressure (typically 1-10 mBar) using mass flow controllers. Allow the system to stabilize for 10 minutes.
- In-situ Experiment: Acquire time-lapse SEM images (every 30-60 seconds) at the ROI to monitor any structural changes (e.g., particle sintering, support morphology).
- FIB Milling under Gas Environment: For 3D analysis, initiate FIB milling at a low current (100 pA) in the gas environment. Pause milling periodically to acquire BSE images for the stack.
- Gas Switching: To study oxidation/reduction cycles, purge the GIS and chamber with an inert gas (Ar), then introduce the second reactive gas (e.g., O₂/He). Repeat imaging and milling.
- Post-reaction Analysis: Return to high vacuum. Perform a final, high-resolution FIB-SEM serial sectioning on the exposed cross-section to quantify pore structural changes post-reaction.
Data Analysis: Correlate time-lapse 2D image changes with the final 3D pore architecture. Measure particle size distribution and pore accessibility before/after gas exposure.
Visualization of Workflows
Title: Workflow for Advanced Catalyst Imaging Protocols
Title: Role of Advanced Protocols in Catalyst Pore Thesis
The Scientist's Toolkit: Research Reagent Solutions
Table 2: Essential Materials for Advanced Catalyst Imaging
| Item | Function & Explanation |
|---|---|
| Slushed Nitrogen | A semi-solid nitrogen slurry at -210°C used for rapid cryo-fixation, providing a cooling rate fast enough to vitrify water/solvents in pores without crystalline ice formation. |
| Cryo-Compatible Adhesive | A specialized, thermally conductive adhesive (e.g., based on silver dag or cryo-gel) that remains adherent and conductive at temperatures below -150°C for secure sample mounting. |
| Platinum Sputter Target | Source for electron-conductive coating. A thin Pt layer (5-10 nm) minimizes charging during imaging while preserving underlying surface topography better than thicker coatings. |
| In-situ Gas Kit (H₂/Ar, O₂/He) | Certified gas mixtures (typically 1-10% reactive gas in balance) for simulating reduction/oxidation environments inside the SEM chamber via a Gas Injection System (GIS). |
| Conductive Carbon Tape/Paint | For mounting non-cryo samples; provides a pathway to ground to prevent charging artifacts during electron imaging. Carbon is preferred for EDX analysis to avoid interference. |
| FIB Lift-Out Needles (Omniprobe) | Micromanipulators used inside the FIB-SEM to extract electron-transparent lamellae from a specific site for subsequent TEM analysis, correlating pore structure with atomic-scale crystallography. |
| Calibration Reference Sample | A standard with known feature size (e.g., a grating) for daily verification of SEM and FIB resolution/scale accuracy, crucial for quantitative pore size measurements. |
Head-to-Head Comparison: Selecting FIB-SEM or CT for Your Catalyst Research
Quantitative Comparison Table
| Feature | FIB-SEM | X-ray Computed Tomography (CT) |
|---|---|---|
| Typical Spatial Resolution | 3-5 nm (in SEM imaging); ~10-20 nm slice thickness. | 0.5 - 5 µm (Lab-source); 50-100 nm (Synchrotron). |
| Maximum Achievable Resolution | <1 nm (with advanced SEM). | ~10-20 nm (Synchrotron with advanced optics). |
| Typical Sample Size (Volume) | ~100 µm x 100 µm x 100 µm (max). Limited by FIB milling time. | mm to cm scale. Limited by X-ray penetration and detector. |
| Destructiveness | Destructive. Sequential milling destroys sample during data acquisition. | Non-destructive. Sample remains intact for further analysis. |
| Relative Cost per Sample Analysis | Very High. Equipment capital cost (~$1M-$3M). High operational skill and time cost. | Moderate to High. Lab-CT capital cost (~$200K-$800K). Synchrotron beamtime is highly competitive/low direct cost but high indirect cost. |
| Primary 3D Reconstruction Method | Sequential slice-and-view imaging. | Mathematical reconstruction from angular radiographs. |
| Key Limitation for Catalysts | Limited representativeness due to tiny volume. Potential Ga+ ion implantation. | Resolution often insufficient for micropores (<2 nm) in zeolites and MOFs. |
Application Notes & Protocols
Application Note 1: Multi-Scale Pore Network Analysis of a Bifunctional Catalyst (e.g., Pt/Zeolite)
Thesis Context: To understand mass transport limitations in a hierarchical catalyst, correlative imaging is essential. CT identifies macroscopic defects and particle distribution, while FIB-SEM targets specific regions for nano-scale pore and active phase interrogation.
Protocol: Correlative CT-to-FIB-SEM Workflow
- Sample Preparation: Embed a catalyst particle bed in epoxy within a polyimide capillary (1-2 mm diameter).
- Lab-based Micro-CT:
- Instrument: ZEISS Xradia 620 Versa or similar.
- Settings: Voltage 80 kV, Power 10 W, 4x objective lens. Collect 2001 projections over 360° with 2-4s exposure.
- Reconstruction: Use instrument software (e.g., Scout-and-Scan Reconstructor) for filtered back-projection. Achieves ~1 µm³ voxel size.
- Analysis: Reconstruct 3D volume. Use Avizo Fire or Dragonfly software for segmentation. Identify regions of interest (ROIs) like large cracks or dense agglomerates.
- Targeted FIB-SEM Sample Preparation:
- Transfer: Extract the capillary. Using the CT data as a map, cleave the bed near the ROI.
- Mounting: Adhere the fragment containing the ROI to a SEM stub.
- Conductive Coating: Apply a thin (5-10 nm) Ir coating via sputter coater to prevent charging.
- FIB-SEM Lift-out: Using a dual-beam FIB-SEM (e.g., Thermo Scientific Helios G4 or TESCAN AMBER X), deposit a protective Pt strap over the ROI. Mill and extract a site-specific cross-section lamella (~15 x 10 x 0.5 µm) using an in-situ micromanipulator.
- High-Resolution FIB-SEM Tomography:
- Mounting: Weld the lamella to a TEM-style grid post.
- Imaging Protocol: Set the SEM beam at 2-5 kV, 50 pA. Use the FIB (Ga+ ion) at 30 kV, 1-3 nA for sequential milling. Slice thickness: 10 nm.
- Alignment & Segmentation: Use Atlas 5 or ORS Dragonfly to align the image stack. Apply AI/ML-based segmentation (e.g., Trainable Weka Segmentation) to distinguish Pt nanoparticles, zeolite micropores/mesopores, and binder phases.
- Data Correlation: Register the FIB-SEM sub-volume within the CT volume coordinate system to create a multi-scale model.
Diagram: Correlative CT-FIB-SEM Workflow for Catalysts
Protocol 2: In-Situ FIB-SEM Tomography of Coke Deposition
Objective: To visualize the 3D distribution and morphology of carbonaceous coke deposits within a spent catalyst pore network over time (post-mortem).
Detailed Methodology:
- Sample: A fixed-bed reactor spent catalyst particle (e.g., coked ZSM-5).
- Mounting & Coating: Fracture particle to expose fresh interior. Mount on stub with conductive tape. Apply Iridium coating (5 nm).
- FIB-SEM Instrument Setup (Thermo Scientific Helios G4):
- Insert sample into chamber (<1e-4 Pa vacuum).
- Navigate to a representative area using the SEM at 5 kV, 0.8 nA.
- Trench Milling:
- Deposit a 1 µm protective carbon strap over the ROI using the GIS.
- Use FIB at 30 kV, 65 nA to mill large trenches on two sides of the strap, creating an accessible wall.
- Automated Tomography Sequence (Using AutoSlice & View):
- SEM Imaging: 2 kV, 50 pA, Through-the-Lens Detector (TLD), 10 µs pixel dwell.
- FIB Milling: 30 kV, 0.5 nA for polishing; slice thickness = 15 nm.
- Cycle: Set to run for 500 slices. Total volume imaged: ~15 µm(w) x 10 µm(h) x 7.5 µm(d).
- Image Processing:
- Stack Alignment: Correct for drift and curtaining artifacts using cross-correlation (e.g., in ImageJ/Fiji with StackReg).
- Segmentation: Apply a random forest classifier in ORS Dragonfly to segment phases: Coke (high brightness, fibrous/amorphous), Metal (bright, dense), Zeolite (intermediate gray), Pores (dark).
- Quantification: Calculate volume fraction, connectivity, and spatial correlation of coke relative to the pore network and metal sites.
The Scientist's Toolkit: Key Research Reagent Solutions
| Item | Function in Catalyst Characterization |
|---|---|
| Conductive Epoxy (e.g., Ag DAG, CW2400) | Mounts and electrically grounds insulating catalyst samples to prevent SEM charging artifacts. |
| Iridium (Ir) Sputter Target | Source for high-quality, fine-grained conductive coating, superior to Au for high-resolution FIB-SEM. |
| Gallium (Ga+) Liquid Metal Ion Source | Standard ion source in FIB for precise milling, deposition, and imaging of catalyst cross-sections. |
| Precursor Gases (e.g., Pt(PF3)4, W(CO)6) | Used in Gas Injection Systems (GIS) for FIB-induced deposition of conductive straps or protective layers. |
| Polystyrene or SiO2 Monodisperse Nanospheres | Used as fiducial markers or for creating calibration standards for pore size measurements in both CT and SEM. |
| Focused Ion Beam (FIB) Lift-Out Grids (e.g., Omniprobe Grids) | Copper or Mo grids with posts for welding and mounting site-specific lamellae for FIB-SEM tomography. |
Diagram: FIB-SEM Tomography Segmentation Logic
This application note is framed within a broader thesis investigating the comparative efficacy of Focused Ion Beam-Scanning Electron Microscopy (FIB-SEM) and X-ray Computed Tomography (CT) for the three-dimensional characterization of pore networks within heterogeneous catalyst supports. The accurate quantification of pore size distribution, connectivity, and tortuosity is critical for modeling mass transport, active site accessibility, and overall catalyst performance. This study details a direct comparison using a standardized mesoporous γ-alumina catalyst support pellet.
Core Data Comparison: FIB-SEM vs. Micro-CT
The following table summarizes key quantitative data extracted from the analysis of the same γ-alumina pellet using both techniques.
Table 1: Quantitative Comparison of Pore Network Characterization
| Parameter | FIB-SEM (Serial Sectioning) | X-ray Micro-CT | Notes |
|---|---|---|---|
| Spatial Resolution | 5 nm (xy), 10 nm (z) | 0.7 µm (isotropic) | FIB-SEM offers superior resolution. |
| Field of View (Volume) | 15 x 15 x 10 µm³ | 1.4 x 1.4 x 1.4 mm³ | CT captures a vastly larger, representative volume. |
| Avg. Pore Diameter | 11.2 ± 3.5 nm | 12.8 ± 4.1 µm* | CT missed mesopores; value reflects large macropores/defects. |
| Porosity (%) | 48.7% | 49.1% | Good agreement for accessible porosity at respective scales. |
| Tortuosity (Calc.) | 2.1 - 2.5 | 1.8 - 2.0 | CT may underestimate due to unresolved pore constrictions. |
| Data Acquisition Time | ~36 hours | ~2 hours | Includes sample prep (FIB-SEM) vs. scan (CT). |
| Volume Damage | Destructive | Non-destructive | FIB-SEM mills the sample; CT leaves it intact. |
*CT measurement reflects the technique's resolution limit, failing to resolve the true mesopores (~10nm).
Experimental Protocols
Protocol A: FIB-SEM Tomography for Nanoscale Pore Analysis
Objective: To reconstruct the 3D nanopore structure within a specific region of interest (ROI) of a catalyst support. Materials: See "The Scientist's Toolkit" below. Procedure:
- Sample Preparation: Mount the alumina pellet on a SEM stub. Sputter-coat with a 10 nm conductive layer (e.g., Au/Pd). Insert into a dual-beam FIB-SEM instrument.
- Protective Deposition: Use the ion beam to deposit a 1 µm thick protective platinum strap over the target ROI.
- Trench Milling: Mill deep trenches on two sides of the ROI using a high-current ion beam (30 kV, 3-15 nA) to create an accessible cross-section.
- Serial Sectioning & Imaging:
- Set the ion beam to a fine milling current (30 kV, 50-300 pA).
- Define an automated routine: Mill away a predefined slice thickness (e.g., 10 nm).
- After each milling step, image the freshly exposed cross-section using the electron beam (e.g., 2 kV, 30 µA) with a backscattered electron detector for material contrast.
- Repeat for 500-1000 slices.
- Image Stack Processing: Align the image series using cross-correlation algorithms. Apply segmentation (e.g., Trainable Weka Segmentation in Fiji) to binarize images into solid and pore phases.
- 3D Reconstruction & Analysis: Reconstruct the volume. Quantify porosity, pore size distribution (via granulometry), connectivity, and tortuosity using software (e.g., Dragonfly, Avizo, or ImageJ).
Protocol B: X-ray Micro-CT for Macro/Meso-Scale Volume Imaging
Objective: To image the internal macrostructure and defect distribution of a full catalyst pellet non-destructively. Materials: See "The Scientist's Toolkit" below. Procedure:
- Sample Mounting: Secure the alumina pellet on a rotary stage within the micro-CT scanner. Ensure it does not move during rotation.
- Scan Parameter Optimization:
- Set voltage and current (e.g., 80 kV, 125 µA) for optimal X-ray penetration and contrast.
- Set exposure time per projection (e.g., 500 ms).
- Determine number of rotational steps over 360° (e.g., 1800 projections).
- Implement optional 2x2 pixel binning to improve signal-to-noise if resolution is sufficient.
- Data Acquisition: Run the scan to collect transmission radiographs (sinograms) from all angles.
- Tomographic Reconstruction: Apply a filtered back-projection algorithm (e.g., Feldkamp-Davis-Kress) to reconstruct a 3D voxel dataset representing X-ray attenuation coefficients.
- Data Processing & Analysis:
- Apply ring artifact and beam hardening corrections.
- Segment the data using global or local thresholding to separate solid, pore, and any dense inclusions.
- Analyze the full volume for porosity, pore network connectivity (via cluster labeling), and detection of large cracks or macro-pores.
Visualization of the Comparative Workflow
Diagram Title: Workflow for Multi-Scale Catalyst Pore Analysis
The Scientist's Toolkit: Key Research Reagent Solutions
Table 2: Essential Materials for FIB-SEM and CT Characterization
| Item | Function / Role in Experiment |
|---|---|
| Mesoporous γ-Alumina Pellet | Standardized catalyst support sample under investigation. |
| Dual-Beam FIB-SEM Instrument | Combines a focused Ga⁺ ion beam for milling/deposition and an electron beam for high-resolution imaging. |
| Gas Injection System (GIS) with Pt Precursor | Injects organometallic gas for ion-beam-induced deposition of protective platinum layers. |
| High-Resolution BSE Detector | Provides atomic number contrast critical for distinguishing pores from the alumina support. |
| Laboratory Micro-CT Scanner | Generates X-rays and captures 2D radiographs for 3D tomographic reconstruction. |
| Calibration Phantom | Used to verify geometric accuracy and grayscale calibration of the CT system. |
| Image Processing Software Suite | For alignment, segmentation, and quantitative analysis of 3D voxel data (e.g., Avizo, Dragonfly, Fiji). |
| Conductive Sputter Coater | Applies a thin metal layer to non-conductive samples to prevent charging in the SEM. |
| Precision SEM Sample Stubs | For secure, stable mounting of the pellet in the FIB-SEM vacuum chamber. |
Application Notes and Protocols
Introduction Within the broader thesis comparing FIB-SEM and X-ray Computed Tomography (CT) for catalyst pore characterization, this study focuses on the critical challenge of hierarchical porosity in Zeolites and Metal-Organic Frameworks (MOFs). These materials contain interconnected pores across multiple scales (micro-, meso-, macro-), which dictate performance in catalysis and drug delivery. Accurately quantifying this 3D pore network requires a correlative, multi-scale imaging approach.
Comparative Imaging Data Table 1: Core Techniques for Hierarchical Porosity Characterization
| Technique | Resolution (Approx.) | Field of View | Depth Penetration | Key Metric for Hierarchical Porosity |
|---|---|---|---|---|
| X-ray Nano-CT | 50 - 500 nm | 10s - 100s µm | Full particle (mm) | Macropore (>50 nm) volume distribution, interconnectivity. |
| Lab µ-CT | 1 - 10 µm | mm - cm | Full pellet/device | Macroporosity & particle packing in a fixed bed or tablet. |
| FIB-SEM Tomography | 5 - 20 nm (XY) | 10s µm (XY) | ~50 µm (Z) | 3D morphology of meso/macropores (2-500 nm), pore accessibility. |
| SEM (Surface) | 1 - 10 nm | 10s - 100s µm | Surface only | Mesopore surface texture, particle morphology. |
| sXRM/ ptychography | < 50 nm | < 50 µm | 10s µm | Lattice defects, partial crystallinity in MOFs, local strain. |
Table 2: Quantitative Outputs from a Correlative Workflow (Example: Zeolite Pellet)
| Pore Scale | Primary Technique | Measured Parameters | Typical Value Range |
|---|---|---|---|
| Inter-particle (Macro) | Lab µ-CT | Inter-particle void fraction, coordination number | 20-40%, 4-8 |
| Intra-particle (Meso/Macro) | X-ray Nano-CT | Macropore volume, tortuosity (τ) | 5-15%, τ: 1.5-4.0 |
| Intra-particle (Meso) | FIB-SEM Tomography | Mesopore surface area (internal), pore size distribution | 10-100 m²/g, 10-100 nm peak |
| Intra-crystalline (Micro) | N₂ Physisorption | Micropore volume, BET surface area | 0.1-0.3 cm³/g, 300-800 m²/g |
Experimental Protocols
Protocol 1: Correlative Nano-CT to FIB-SEM Workflow for a Single MOF Crystal Objective: To map the connectivity between internal macropores (defects) and the external surface mesopores.
- Mounting: Secure a single MOF crystal (~30µm) on a tomography pin stub using conductive epoxy.
- Nano-CT Imaging:
- Use a laboratory or synchrotron-based X-ray nano-CT system.
- Acquire > 1500 projections over a 180° rotation at 40-50 nm voxel size.
- Reconstruct using a filtered back-projection or iterative algorithm.
- Analysis: Segment internal macropores using global thresholding (e.g., Otsu's method). Calculate pore volume and centroid locations.
- Targeted Transfer & FIB-SEM:
- Transfer the same, unmounted pin to a FIB-SEM equipped with a micromanipulator.
- Use the nano-CT 3D model to navigate to a region of interest containing a major macropore.
- Deposit a protective Pt strap over the target site.
- Perform sequential FIB milling and SEM imaging (5 nm slice thickness, 10 nm pixel size).
- Analysis: Align and segment the image stack. Isolate the mesopore network. Register this 3D model with the nano-CT data using the macropore as a fiducial marker to create a unified pore network model.
Protocol 2: Volume-of-Interest (VOI) Lamella Preparation for Zeolite Mesoporosity Objective: To extract a site-specific TEM lamella from a region of mesoporosity identified by prior CT for atomic-scale analysis.
- Pre-location with Lab µ-CT: Image the entire zeolite pellet (5 µm/voxel). Identify a region with high intra-particle void fraction.
- Sample Trimming: Using a precision saw, extract a ~1 mm subsection containing the VOI.
- Mounting for FIB: Glue the subsection onto a SEM stub. Sputter-coat with 20 nm Au/Pd.
- FIB-SEM Navigation & Lamella Preparation:
- Use the µ-CT data as a map to navigate the SEM to the general VOI.
- Deposit electron and ion-beam Pt protective layers.
- Perform standard in-situ lift-out with a micromanipulator and weld to a TEM grid.
- Thin to electron transparency (< 100 nm) at low keV (2-5 kV) for final polish.
- STEM/EDX Analysis: Image the lamella in Scanning Transmission Electron Microscopy (STEM) mode to resolve mesopore walls and perform Energy-Dispersive X-ray spectroscopy (EDX) for elemental mapping of possible promoters or blockages.
Visualizations
Correlative Nano-CT to FIB-SEM Workflow
Thesis Context of Imaging Techniques
The Scientist's Toolkit: Research Reagent Solutions & Essential Materials
Table 3: Key Materials for Multi-Scale Imaging of Hierarchical Porous Materials
| Item | Function / Application |
|---|---|
| Conductive Epoxy (e.g., Ag-filled) | Mounting fragile crystals for CT/FIB-SEM, preventing charging. |
| Iodine-Containing Staining Solution (e.g., Lugol's) | Contrast enhancement for polymer/soft matter in MOF composites during lab CT. |
| Gallium Liquid Metal Ion Source | Standard source for precise FIB milling in FIB-SEM systems. |
| Organometallic Pt/Gas Injection System (GIS) | Deposits conductive and protective straps for FIB-SEM tomography. |
| Xenon Plasma FIB (Xe-PFIB) Source | Alternative to Ga⁺ for high-volume, artifact-free milling of delicate MOFs. |
| Micromanipulator & Omniprobe | For in-situ lift-out of TEM lamellae from specific VOIs. |
| Focused Electron Beam Induced Deposition (FEBID) GIS | Enables precise, electron-beam-based Pt deposition for minimal damage prior to imaging. |
| PELCO NanoSilver Conductive Paste | Low-outgassing paste for high-vacuum mounting of CT samples for subsequent FIB. |
Within catalyst pore characterization research, a persistent challenge is bridging the gap between high-resolution, localized structural information and lower-resolution, volumetric context. Focused Ion Beam-Scanning Electron Microscopy (FIB-SEM) provides exquisite nanoscale surface and cross-sectional detail but is inherently destructive and limited in field of view. X-ray Computed Tomography (CT) offers non-destructive, three-dimensional visualization of entire millimeter-scale samples but at a resolution typically limited to hundreds of nanometers. This application note details protocols for the correlative use of these techniques, where CT guides targeted FIB-SEM analysis to statistically validate pore networks, co-locate features of interest, and create comprehensive 3D models of catalyst architectures.
The quantitative capabilities of each technique and their synergistic outputs are summarized below.
Table 1: Technical Specifications of FIB-SEM and CT for Catalyst Analysis
| Parameter | X-ray CT (Lab-based) | FIB-SEM | Correlative Output |
|---|---|---|---|
| Resolution | 0.5 - 5 µm | 1 - 5 nm (SEM), 5 - 20 nm (FIB) | Context at 1 µm, detail at 5 nm |
| Field of View | Entire pellet (mm-scale) | 10x10 µm to 100x100 µm | Targeted navigation to ROI |
| Depth of Analysis | Full sample volume (mm) | 10 - 50 µm milled depth | Depth-correlated structure |
| Sample Prep | Minimal (mounting) | Conductive coating, milling | CT-guided site selection |
| Data Type | 3D attenuation map | 3D serial sectioning or 2D surface | Registered multi-scale 3D model |
| Key Metric | Porosity %, Pore connectivity | Pore size distribution, wall composition | Validated pore network model |
Table 2: Quantitative Pore Analysis from a Model Zeolite Catalyst (Hypothetical Data)
| Analysis Metric | CT-Derived Data (Whole Pellet) | FIB-SEM Derived Data (Targeted ROI) | Correlation Benefit |
|---|---|---|---|
| Global Porosity | 32% ± 2% | N/A | Provides ground truth for bulk |
| Macropore (>50nm) Dia. | 1.2 µm (avg) | 1.1 µm (avg) | Validates CT segmentation |
| Mesopore (2-50nm) Dia. | Not resolved | 22 nm (avg) | Adds critical missing data |
| Pore Connectivity (τ) | 2.8 | 3.1 | Confirms transport pathways |
| Surface Area Estimate | 15 m²/g (macro) | 320 m²/g (macro+meso) | Achieves accurate total |
Correlative Workflow Protocol
Protocol 1: CT-Guided Site Selection for FIB-SEM
Objective: To identify regions of interest (ROIs) within a catalyst pellet for high-resolution FIB-SEM trenching and serial sectioning.
- Sample Preparation: Mount a whole catalyst pellet (e.g., 1mm diameter) on a standard CT stub using adhesive clay. For conductive samples, apply a thin carbon tape strip for grounding.
- X-ray CT Scanning:
- Instrument: Lab-based micro-CT (e.g., Zeiss Xradia 520 Versa).
- Settings: Voltage: 80 kV, Power: 7 W, Filter: LE1. Acquire 1601 projections over 360°.
- Reconstruction: Use instrument software (e.g., Reconstructor Scout-and-Scan) to create a 3D volume with isotropic voxel size of 700 nm.
- ROI Identification & Marking:
- Import reconstructed volume into analysis software (e.g., Dragonfly, Avizo).
- Perform segmentation (e.g., global thresholding) to isolate pore space and catalyst material.
- Analyze pore size distribution and connectivity maps. Select ROIs representing: (a) high-porosity zones, (b) low-porosity zones, (c) regions near visible cracks or defects.
- Critical Step: Using software, record the (x, y, z) coordinates of each ROI within the 3D volume relative to a fixed, visible feature on the pellet's surface (e.g., a large, distinct pore).
- Sample Transfer & Relocation:
- Carefully transfer the pellet from the CT stub to a FIB-SEM compatible stub (e.g., with a conductive pin). Maintain a known orientation (mark top with conductive pen).
- In the FIB-SEM (e.g., Thermo Scientific Helios G4), use the SEM at low magnification (50-100x) to locate the same surface feature used as a reference in Step 3.
- Using the known offset distances from the reference feature, navigate the SEM stage to the approximate location of the first ROI.
- Use a low-current, high-resolution SEM scan (5 kV, 50 pA) to image the surface. Correlate the surface topography with the CT-derived surface rendering to precisely confirm the ROI.
Protocol 2: FIB-SEM Serial Sectioning on a CT-Identified ROI
Objective: To acquire a nanoscale 3D reconstruction of the pore network within a CT-identified ROI.
- Site-Specific Preparation:
- Apply a protective layer of electron-beam deposited platinum (E-beam Pt) followed by ion-beam deposited platinum (I-beam Pt) over the precise ROI (approx. 15x15 µm area).
- Rough Trench Milling:
- Use the FIB (30 kV, 9 nA) to mill large access trenches on two sides of the protected ROI, creating a "lamella" or pillar.
- Serial Sectioning & Imaging:
- Polish the Analysis Face: Use progressively lower FIB currents (1 nA to 100 pA) to polish the front face of the pillar.
- Automated Run: Set up an automated serial sectioning recipe.
- Milling: Use a 30 kV, 50 pA beam to mill a 5 nm thick slice from the face.
- Imaging: Immediately after each mill, image the freshly exposed cross-section with the SEM at 2 kV, 50 pA, using the Through-the-Lens Detector (TLD). Pixel size: 5 nm.
- Repeat: Sequence for 1000 slices to generate a 3D volume 5 µm in depth.
- Data Alignment & Reconstruction: Use dedicated software (e.g., Fiji with StackReg, ORS Dragonfly) to align the image stack and segment the pore space to create a binary 3D model.
Protocol 3: Data Correlation and Model Fusion
Objective: To register the FIB-SEM nanoscale volume within the wider CT volume.
- Landmark Identification: Identify at least three distinct, matching features that are visible in both the CT volume (after up-sampling) and the FIB-SEM volume (after down-sampling). These can be large, distinct pore junctions or dense inclusions.
- Affine Registration: Use registration software (e.g., Elastix, Avizo) to perform a rigid (translation, rotation) followed by an affine transformation of the FIB-SEM volume to align it with the CT sub-volume.
- Data Fusion & Analysis: The registered FIB-SEM data serves as a "ground truth" patch. Its mesopore network data can be used to validate and refine the segmentation parameters of the global CT data, leading to a more accurate and complete model of the catalyst's hierarchical porosity.
Correlative Workflow Visualization
Diagram 1: Correlative FIB-SEM and CT Workflow
The Scientist's Toolkit: Essential Research Reagents & Materials
Table 3: Key Materials for Correlative FIB-SEM/CT of Catalysts
| Item | Function in Protocol | Critical Notes |
|---|---|---|
| Conductive Carbon Tape | Mounts sample for CT and provides grounding path for FIB-SEM. | Use high-purity tape to minimize X-ray artifacts and outgassing. |
| Electron-Beam Depicted Pt Precursor (e.g., Pt(PF₃)₄) | Deposits a conformal, protective conductive layer over ROI prior to FIB milling. | Prevents "curtaining" artifacts and preserves surface detail. |
| Ion-Beam Depicted Pt or W Precursor | Deposits a dense, protective cap atop the e-beam Pt layer. | Provides robust protection against high-current Ga⁺ ion milling. |
| Conductive Silver Paste / Epoxy | Permanently bonds sample to FIB-SEM stub for stability during serial sectioning. | Ensure it is vacuum-compatible and cures fully to prevent drift. |
| Fiducial Markers (e.g., Au Nanoparticles on SiO₂) | Optional for difficult registration. Provide high-contrast landmarks in both CT and SEM. | Sparse application on sample surface near ROI. |
| Static-Line Ion Getter Pump | Critical for maintaining ultra-high vacuum (UHV) in FIB-SEM chamber during Pt deposition. | Ensures clean, pure deposition without hydrocarbon contamination. |
| Micromanipulator & Needle (OmniProbe) | For in-situ lift-out of a specific lamella if analysis at a second facility is required. | Allows transfer of the exact ROI to a different holder or instrument. |
Application Notes
This framework provides a structured approach for selecting between Focused Ion Beam-Scanning Electron Microscopy (FIB-SEM) and X-ray Computed Tomography (CT) for characterizing the 3D pore architecture of solid catalysts. The choice is critical for accurate structure-property correlation, impacting catalyst design for energy and pharmaceutical applications.
Key Decision Drivers:
- Resolution vs. Field of View: FIB-SEM offers higher resolution (typically 3-10 nm) but limited volume. CT provides larger volumes (>100 µm³) but lower resolution (typically 50-500 nm).
- Material Compatibility: FIB-SEM is destructive and requires conductive coatings for insulating samples. CT is generally non-destructive but requires X-ray transparency and contrast.
- Question Type: FIB-SEM is ideal for nano-scale porosity, pore connectivity, and catalyst layer thickness. CT excels at analyzing macro-pore networks, spatial distribution of phases, and diffusion pathways on a larger scale.
Comparative Data Summary:
Table 1: Quantitative Comparison of FIB-SEM and CT for Catalyst Characterization
| Parameter | FIB-SEM (Typical) | X-ray CT (Laboratory) | X-ray CT (Synchrotron) |
|---|---|---|---|
| Spatial Resolution | 3 - 10 nm | 0.5 - 5 µm | 50 - 500 nm |
| Max Volume Dimension | ~50 µm | >1 mm | ~1 mm |
| Data Acquisition Time | 6 - 24 hours | 0.5 - 2 hours | Minutes to hours |
| Sample Preparation | Destructive (sectioning), Conductive coating often needed | Minimal, Non-destructive | Minimal, Non-destructive |
| Primary Contrast | Density/atomic number (SEM), Material removal (FIB) | X-ray attenuation (density, atomic number) | X-ray attenuation & phase contrast |
| Ideal for Catalyst | Meso/micro-pores, coating uniformity, nano-features | Macro-pore networks, particle distribution, large defects | High-res 3D of hierarchical pore structures |
Experimental Protocols
Protocol 1: FIB-SEM Tomography for Catalyst Pellet Nano-Porosity Objective: To obtain the 3D nano-structure of a catalyst pellet's active coating or internal mesoporous network. Materials: Zeolite catalyst pellet, Conductive silver paint, Sputter coater, FIB-SEM system (e.g., Thermo Scientific Scios 2, Zeiss Crossbeam). Procedure:
- Mounting: Attach the pellet to a SEM stub using conductive silver paint.
- Coating: Sputter-coat the sample with a 5-10 nm layer of iridium or platinum to enhance conductivity and protect the surface.
- FIB-SEM Setup: Insert the sample into the FIB-SEM chamber. Use the SEM to locate the region of interest (ROI).
- Deposition: Use the ion beam to deposit a protective platinum strap (1-2 µm thick) over the ROI.
- Trench Milling: Mill deep trenches on two sides of the protected ROI to create an accessible face for imaging.
- Serial Sectioning & Imaging:
- Set the FIB to mill a thin slice (e.g., 10 nm) from the front of the ROI.
- Switch to the SEM to image the newly revealed cross-section using a backscattered electron detector for material contrast.
- Automate and repeat this slice-and-view cycle for 200-500 slices.
- Data Reconstruction: Align the image stack using cross-correlation software (e.g., Fiji/TrakEM2). Segment phases (pores, support, active particles) via thresholding. Reconstruct 3D volume using Avizo or Dragonfly software.
Protocol 2: X-ray CT for Catalyst Pellet Macro-Structure & Defect Analysis Objective: To visualize the internal macro-pore network, cracks, and density variations in a batch of catalyst pellets non-destructively. Materials: Catalyst pellet(s), Laboratory micro-CT system (e.g., Bruker Skyscan, Zeiss Xradia). Procedure:
- Mounting: Secure the pellet on a rotary stage using low-density foam or a plastic holder. Ensure it does not move during rotation.
- System Alignment: Perform geometric alignment and flat-field correction of the X-ray detector using standard protocols.
- Acquisition Settings: Optimize parameters: Voltage (40-80 kV for zeolites), Current, Exposure time, Rotation step (0.2°-0.4°). Use a 0.5 mm aluminum filter to harden the beam and reduce ring artifacts.
- Scan: Acquire projection images over a 180° or 360° rotation.
- Reconstruction: Use the system's software (e.g., NRecon) to apply filtered back-projection, correcting for beam hardening and ring artifacts. Generate a 16-bit grayscale volume dataset.
- Analysis: Import volume into analysis software (e.g., CTVox, Dragonfly). Use global or local thresholding to segment pores from solid. Calculate porosity, pore size distribution, and connectivity.
Mandatory Visualization
Title: Decision Flowchart for FIB-SEM vs CT Selection
The Scientist's Toolkit
Table 2: Essential Research Reagent Solutions & Materials
| Item | Function in Characterization |
|---|---|
| Iridium Sputter Target | Provides a fine-grained, conductive coating for FIB-SEM samples, reducing charging and protecting from ion beam damage. |
| Gallium Liquid Metal Ion Source (LMIS) | Standard ion source in FIB for precise milling and sectioning of catalyst material. |
| Conductive Silver Epoxy | Electrically bonds and secures the catalyst sample to the SEM stub, preventing drift. |
| Low-Density Mounting Foam | Holds catalyst pellets stable in the X-ray CT stage with minimal X-ray absorption. |
| X-ray Beam Filter (Aluminum) | Used in laboratory CT to "harden" the polychromatic beam, reducing cupping and ring artifacts. |
| Reference Calibration Phantom | Contains known density materials for calibrating grayscale values in CT data to quantitative density. |
| Image Stack Alignment Software (e.g., Fiji) | Critical for correcting slice-to-slice drift in FIB-SEM serial sectioning data. |
| 3D Segmentation Software (e.g., Avizo, Dragonfly) | Enables visualization, segmentation, and quantitative analysis of pore networks from both FIB-SEM and CT volumes. |
Conclusion
FIB-SEM and X-ray CT are powerful, complementary tools for 3D catalyst pore characterization, each with distinct strengths. FIB-SEM excels at providing ultra-high-resolution nanoscale details of pore morphology and connectivity but is destructive and limited in field of view. CT offers non-destructive, rapid 3D imaging of larger, millimeter-scale volumes, ideal for studying macro-pores and bulk heterogeneity, albeit at lower resolution. The optimal choice depends fundamentally on the specific pore size range of interest, the required field of view, and the sample's tolerance to destructive preparation. Future directions point towards the increased integration of these techniques through correlative microscopy, the application of machine learning for automated segmentation and analysis, and the development of in-situ and operando capabilities to observe pore dynamics under realistic conditions. This evolution will provide unprecedented insights into structure-property relationships, accelerating the rational design of next-generation, high-performance catalysts.