High-Throughput Screening for Catalyst Discovery: Integrating Computational and Experimental Methods
This article provides a comprehensive overview of high-throughput screening (HTS) methodologies accelerating catalyst discovery.
High-Throughput Screening for Catalyst Discovery: Integrating Computational and Experimental Methods
Abstract
This article provides a comprehensive overview of high-throughput screening (HTS) methodologies accelerating catalyst discovery. It explores the foundational shift from traditional trial-and-error approaches to integrated computational and experimental paradigms, detailing specific applications of density functional theory, machine learning, and automated experimental setups. The content addresses critical challenges in data quality, assay validation, and hit identification, while presenting a comparative analysis of screening strategies. Aimed at researchers and development professionals, this review synthesizes current advancements and future directions for developing cost-competitive, high-performance catalytic materials for energy and chemical applications.
The Paradigm Shift in Catalyst Discovery: From Trial-and-Error to High-Throughput Methodologies
Catalysis, the process of increasing the rate of a chemical reaction without itself being consumed, is fundamental to the chemical industry, with an estimated 90% of all commercially produced chemical products involving catalysts at some stage of their manufacture [1]. The systematic study of catalysis began in the 1700s, with Elizabeth Fulhame providing its theoretical foundation and Jöns Jakob Berzelius coining the term "catalysis" in 1835 [2] [1]. Research methodologies have evolved through three distinct stages: from early empirical discovery, through a computational and high-throughput screening phase, to the emerging paradigm of autonomous and data-driven research. This evolution has been driven by the need to develop more efficient, selective, and sustainable chemical processes, particularly those supporting renewable energy and environmental goals [2] [3]. Within this context, high-throughput screening methods have become indispensable for accelerating the discovery and optimization of novel catalysts, enabling researchers to efficiently navigate the vast multi-dimensional space of possible catalytic materials [4].
The Empirical Foundations Stage (1700s–Late 20th Century)
The first stage of catalysis research was characterized by experimental observation and serendipitous discovery. Researchers identified catalytic materials through trial-and-error experimentation, with theoretical understanding lagging behind practical application.
Key Methodological Approaches
The empirical stage relied heavily on observation of natural processes and laboratory experimentation with systematic variation of reaction conditions. Paul Sabatier's work in the late 19th and early 20th centuries exemplified this approach, leading to the discovery of many metal catalysts, particularly nickel and platinum group metals, through meticulous experimentation [2]. This period also saw the development of bulk characterization techniques such as X-ray diffraction and basic spectroscopy, which provided limited insights into catalyst structure.
Classic Experimental Protocols
A representative experimental protocol from this era involved the systematic testing of catalyst formulations:
- Catalyst Preparation: Materials were prepared using standard synthesis methods like precipitation, impregnation, or fusion. For example, heterogeneous catalysts for the Haber process were described as iron but were actually complex mixtures of iron-potassium-calcium-aluminum-oxide [1].
- Reactor Testing: Catalysts were tested in fixed-bed or batch reactors under varying conditions of temperature, pressure, and reactant concentrations.
- Product Analysis: Researchers used techniques like gas chromatography, titration, or spectroscopy to quantify reaction products and calculate conversion and selectivity.
- Kinetic Modeling: Reaction rates were measured and fitted to kinetic models to understand reaction mechanisms.
Table 1: Landmark Empirical Discoveries in Catalysis
| Time Period | Catalyst Discovery | Methodological Approach | Industrial Application |
|---|---|---|---|
| Late 1700s | Acids for ester hydrolysis | Systematic solution chemistry | Various chemical processes |
| Early 1900s | Nickel catalysts | Gas-solid reaction testing | Hydrogenation reactions |
| Early 1900s | Vanadium(V) oxide | Oxide screening | Contact process (SO₂ to SO₃) |
| Mid-1900s | Zeolites | Crystal structure analysis | Petroleum refining |
Limitations and Legacy
The empirical approach suffered from several limitations: the high cost and slow pace of experimentation, limited fundamental understanding of reaction mechanisms, and the inability to predict catalyst performance from first principles. Despite these constraints, this era established foundational catalytic processes still in use today, including the Haber process for ammonia synthesis and the contact process for sulfuric acid production [5] [1]. The phenomenological "Seven Pillars" of oxidation catalysis proposed by Robert K. Grasselli—encompassing lattice oxygen, metal-oxygen bond strength, host structure, redox properties, multifunctionality of active sites, site isolation, and phase cooperation—represented a high point of empirical knowledge, summarizing the essential features for designing metal oxides for selective hydrocarbon oxidation [6].
The Computational and High-Throughput Screening Stage (Late 20th Century–Present)
The second stage of catalysis research emerged with advances in computational power and the adoption of parallel experimentation techniques. This paradigm shift enabled researchers to move beyond trial-and-error approaches toward more rational catalyst design.
Methodological Advances
The computational screening stage introduced several transformative approaches:
- First-Principles Calculations: Density functional theory (DFT) allowed researchers to predict catalytic properties by calculating electronic structures, adsorption energies, and reaction pathways [4] [6].
- Descriptor-Based Screening: Electronic structure descriptors such as the d-band center and related parameters enabled the prediction of catalytic activity and selectivity trends [4] [6].
- High-Throughput Experimentation: Automated synthesis and testing platforms enabled the parallel preparation and evaluation of hundreds to thousands of catalyst candidates [4].
High-Throughput Screening Protocol for Bimetallic Catalysts
A representative high-throughput protocol for discovering bimetallic catalysts involves the following steps [4]:
Computational Prescreening
- Define reference material (e.g., Pd for H₂O₂ synthesis)
- Generate candidate structures (4,350 bimetallic alloys in demonstrated study)
- Calculate formation energies (ΔEf) to assess thermodynamic stability
- Filter candidates with ΔEf < 0.1 eV/atom
Electronic Structure Analysis
- Calculate density of states (DOS) patterns for stable candidates
- Quantify similarity to reference catalyst using ΔDOS metric: where g(E;σ) is a Gaussian weighting function centered at the Fermi energy
- Select top candidates with lowest ΔDOS values
Experimental Validation
- Synthesize screened candidates (e.g., via impregnation, co-precipitation)
- Evaluate catalytic performance (e.g., H₂O₂ synthesis from H₂ and O₂)
- Measure activity, selectivity, and stability under working conditions
- Compare with reference catalyst and computational predictions
This protocol successfully identified several promising Pd-free catalysts, including Ni₆₁Pt₃₉, which exhibited a 9.5-fold enhancement in cost-normalized productivity compared to conventional Pd catalysts [4].
Diagram 1: High-throughput screening workflow for bimetallic catalyst discovery. The protocol combines computational screening with experimental validation to identify promising catalysts efficiently [4].
Research Reagent Solutions
Table 2: Essential Research Reagents and Materials for High-Throughput Catalyst Screening
| Reagent/Material | Function/Application | Example Usage |
|---|---|---|
| Transition Metal Precursors (Salts, Complexes) | Active phase components | Ni, Pt, Pd, Au salts for bimetallic catalysts [4] |
| Support Materials (Alumina, Zeolites, Carbon) | High-surface-area carriers | Catalyst dispersion and stabilization [1] |
| DFT Simulation Software | Electronic structure calculation | VASP, Quantum ESPRESSO for property prediction [4] |
| High-Throughput Reactor Systems | Parallel reaction testing | Simultaneous evaluation of multiple catalysts [4] [7] |
Quantitative Performance Data
Table 3: Experimental Results for Screened Bimetallic Catalysts [4]
| Catalyst Composition | DOS Similarity (ΔDOS) | Catalytic Performance | Cost-Normalized Productivity |
|---|---|---|---|
| Pd (Reference) | 0 (Reference) | Baseline | 1.0 (Reference) |
| Ni₆₁Pt₃₉ | 1.72 | Comparable to Pd | 9.5 × Pd |
| Au₅₁Pd₄₉ | 1.45 | Comparable to Pd | Not specified |
| Pt₅₂Pd₄₈ | 1.52 | Comparable to Pd | Not specified |
| Pd₅₂Ni₄₈ | 1.63 | Comparable to Pd | Not specified |
| FeCo (B2) | 1.63 | Not validated | Not validated |
| CrRh (B2) | 1.97 | Not validated | Not validated |
The Autonomous and Data-Driven Stage (Emerging Paradigm)
The emerging third stage of catalysis research integrates artificial intelligence, autonomous laboratories, and standardized data frameworks to create self-optimizing catalyst discovery systems.
Methodological Innovations
The autonomous research paradigm introduces several groundbreaking approaches:
- Machine Learning and AI: Advanced algorithms identify complex patterns in high-dimensional data, enabling predictive models for catalyst design without complete mechanistic understanding [7] [6].
- Autonomous Laboratories: Robotic systems coupled with AI-driven decision-making can plan, execute, and analyze experiments with minimal human intervention [7].
- Standardized Data Handbooks: Community-wide adoption of standardized measurement protocols and data reporting ensures high-quality, reusable datasets for AI training [6].
Autonomous Workflow Protocol
An autonomous catalyst discovery workflow integrates multiple advanced methodologies:
Hypothesis Generation
- AI analysis of existing literature and experimental data
- Identification of promising compositional and structural spaces
- Prediction of novel catalyst candidates with desired properties
Autonomous Computation
- Robotic DFT calculations to screen candidate materials
- Reinforcement learning to optimize calculation strategies
- Automatic detection of promising candidates for experimental validation
Autonomous Experimentation
- Robotic synthesis of predicted catalysts
- High-throughput testing under realistic conditions
- Real-time adaptive optimization based on incoming data
Closed-Loop Learning
- Experimental results fed back to improve computational models
- Continuous refinement of prediction accuracy
- Expansion of chemical space exploration based on accumulated knowledge
This integrated approach significantly reduces the human cost and time required for catalyst development while potentially discovering non-intuitive catalyst formulations that might be overlooked by human researchers [7].
Diagram 2: Autonomous catalysis research cycle. This closed-loop system integrates AI, automated computations, and robotic laboratories to accelerate catalyst discovery [7].
Experimental Handbook Framework
The implementation of autonomous research requires standardized data collection protocols. A proposed handbook framework for catalytic oxidation includes [6]:
- Minimum Reporting Standards: Compulsory documentation of catalyst history, pretreatment conditions, and structural evolution during operation.
- Reference Materials: Inclusion of benchmark catalysts in all experimental series to enable cross-laboratory data comparison.
- Stability Testing Protocols: Standardized procedures for assessing catalyst deactivation and regeneration.
- Data Formats: Uniform data templates ensuring compatibility with AI and machine learning algorithms.
Research Reagent Solutions for Autonomous Discovery
Table 4: Essential Tools and Reagents for Autonomous Catalysis Research
| Tool/Reagent | Function/Application | Implementation |
|---|---|---|
| Robotic Synthesis Platforms | Automated catalyst preparation | Liquid handling, impregnation, calcination robots [7] |
| AI/ML Software Suites | Predictive model development | TensorFlow, PyTorch with chemical informatics extensions [7] [6] |
| Standardized Catalyst Libraries | Reference materials and benchmarks | Certified oxide supports, metal precursors [6] |
| In Situ/Operando Characterization | Real-time monitoring of catalyst structure | XRD, XPS, spectroscopy during reaction [6] |
The evolution of catalysis research from empirical observations to computational screening and now toward autonomous discovery represents a fundamental transformation in methodological approaches. High-throughput screening serves as the critical bridge between the first and third stages of this evolution, enabling the rapid assessment of catalyst candidates predicted by computational methods. The emerging paradigm of autonomous catalysis research promises to significantly accelerate the discovery of novel catalysts for essential applications such as renewable energy conversion, carbon dioxide utilization, and sustainable chemical synthesis [2] [3] [7]. As these methodologies mature and become more widely adopted, they will likely transform catalyst development from a largely empirical art to a predictive science, ultimately supporting the transition to a more sustainable chemical industry.
Core Principles of High-Throughput Screening in Materials Science
High-Throughput Screening (HTS) is an indispensable technology that has transformed discovery processes across multiple scientific disciplines. In materials science, it enables the rapid testing of thousands to millions of material compositions, structures, or processing conditions to identify candidates with desirable properties. This approach is particularly valuable in catalyst discovery research, where it greatly speeds up the progress of identifying and optimizing new catalytic materials by systematically exploring vast parameter spaces that would be impractical to investigate through traditional one-at-a-time experimentation. The core principle involves using automation, miniaturized assays, and parallel processing to accelerate the discovery and optimization of functional materials, significantly reducing time, reagent consumption, and labor expenses compared to conventional methods [8].
The global HTS market, valued at approximately $18.8 billion for 2025-2029, reflects its critical role in industrial and academic research, with significant applications in pharmaceutical development, materials science, and catalyst discovery. Market analysis indicates that HTS can reduce development timelines by approximately 30% and improve forecast accuracy by up to 18% in materials science applications, demonstrating its transformative impact on research efficiency [9].
Core Principles and Quantitative Foundations
The implementation of HTS in materials science is governed by several interconnected principles that ensure efficient, reliable, and meaningful results. These principles encompass experimental design, data acquisition, and analysis methodologies specifically adapted for the unique challenges of material systems.
Digital Barcoding for Sample Multiplexing
A fundamental principle of modern HTS is the use of digital barcodes to label individual samples, enabling simultaneous processing and analysis of thousands of unique specimens. This multiplexing capability is the cornerstone of achieving high throughput. Four primary barcoding technologies have been successfully adapted for materials research, each with distinct characteristics and detection methodologies [8].
Table 1: Digital Barcoding Technologies for HTS in Materials Science
| Barcode Type | Encoded Information | Detection Method | Applications in Materials Science | Key Advantages |
|---|---|---|---|---|
| Fluorescence Barcode [8] | Presence/Absence of fluorescent dyes (1 bit/dye) | Flow Cytometry, Fluorescence Microscopy | Analysis of material-cell interactions, screening of functionalized nanoparticles | High detection speed, compatible with live-cell assays |
| DNA Barcode [8] | Nucleotide sequences (2 bits/nucleotide) | Second-Generation DNA Sequencing | Screening of drug delivery vehicles (e.g., lipid nanoparticles, polymers), catalyst libraries | Extremely high multiplexing capacity (4N codes for N nucleotides) |
| Heavy Metal Barcode [8] | Isotopes of rare earth and transition metals | Mass Cytometry | High-dimensional analysis of material properties and effects | Minimal signal overlap, enables detection of >40 simultaneous labels |
| Nonmetal Isotope Barcode [8] | Stable isotopes (e.g., 13C, 15N) | Secondary-Ion Mass Spectrometry (SIMS) | Mapping material composition and chemical activity at high resolution | Enables highly multiplexed spatial imaging |
Quantitative Data Analysis and Curve Fitting
In quantitative HTS (qHTS), materials are tested across a range of concentrations or conditions, generating concentration-response relationships that are fitted to mathematical models to extract key parameters. The Hill equation (HEQN) is a widely used model for sigmoidal response data, though its application requires careful statistical consideration [10].
The logistic form of the Hill equation is:
( Ri = E0 + \frac{(E\infty - E0)}{1 + \exp{-h[\log Ci - \log AC{50}]}} )
Where:
- ( Ri ) is the measured response at concentration ( Ci )
- ( E_0 ) is the baseline response
- ( E_\infty ) is the maximal response
- ( AC_{50} ) is the concentration for half-maximal response (potency)
- ( h ) is the Hill slope (shape parameter)
The parameter estimates, particularly ( AC_{50} ), are highly sensitive to experimental design. Estimates are precise only when the tested concentration range defines both upper and lower asymptotes of the curve. Failure to capture these asymptotes can lead to confidence intervals spanning several orders of magnitude, greatly hindering reliable material ranking and selection [10].
Table 2: Impact of Experimental Design on Parameter Estimation Reliability
| True AC50 (μM) | True Emax (%) | Sample Size (n) | Mean & [95% CI] for AC50 Estimates | Implications for Materials Screening |
|---|---|---|---|---|
| 0.001 [10] | 25 [10] | 1 [10] | 7.92e-05 [4.26e-13, 1.47e+04] [10] | Highly unreliable for ranking material potency |
| 0.001 [10] | 50 [10] | 5 [10] | 2.91e-04 [5.84e-07, 0.15] [10] | Improved but still variable for low-efficacy materials |
| 0.1 [10] | 50 [10] | 3 [10] | 0.10 [0.06, 0.16] [10] | Reliable estimation when asymptotes are defined |
| 0.1 [10] | 50 [10] | 5 [10] | 0.10 [0.05, 0.20] [10] | Excellent precision for high-confidence decisions |
Artifact Identification and Data Quality Control
HTS data, particularly in complex material systems, are susceptible to various artifacts that can compromise data quality. A robust HTS pipeline must incorporate protocols to identify and flag these artifacts. Major confounding factors include autofluorescence of materials and cytotoxic effects in cell-based assays. On average, cytotoxicity affects approximately 8% of compounds in screening libraries, while autofluorescence affects less than 0.5% [11].
Advanced data analysis pipelines adopt metrics like the weighted Area Under the Curve (wAUC) to quantify total activity across the tested concentration range. This metric has demonstrated superior reproducibility (Pearson’s r = 0.91) compared to point estimates like AC50 (r = 0.81) or point-of-departure (POD) concentration (r = 0.82), making it particularly valuable for robust material prioritization [11].
Experimental Protocols for HTS in Catalyst Discovery
The following protocol provides a framework for applying HTS principles to catalyst discovery research, incorporating best practices from established screening methodologies.
Protocol: High-Throughput Screening of Heterogeneous Catalyst Libraries
Objective: To rapidly identify and optimize solid-state catalyst materials for a target chemical reaction from a diverse library of compositions.
Principle: A library of catalyst candidates is synthesized in a miniaturized format (e.g., 96- or 384-well microplates). Each catalyst is evaluated in parallel using a high-throughput reactor system coupled to a rapid detection method (e.g., mass spectrometry, gas chromatography). Catalytic performance (e.g., conversion, selectivity) is measured and analyzed to select lead candidates for further validation [12] [9].
Step 1: Library Design and Miniaturized Synthesis
- Library Design: Define the compositional space to be explored (e.g., mixed metal oxides, supported metals). Use design of experiments (DoE) software to maximize coverage of the parameter space with a minimal number of discrete compositions.
- Substrate Preparation: Use functionalized wafer substrates or pre-fabricated microplates suitable for high-temperature reactions.
- Automated Synthesis: Employ robotic liquid handlers and inkjet printers to deposit precursor solutions in a combinatorial fashion onto the substrate.
- Reagent Solutions: Metal salt precursors (e.g., nitrates, chlorides), solvent (e.g., water, ethanol), stabilizing agents (e.g., polymers).
- Calcination: Programmable furnace to convert precursors to final catalytic materials (e.g., 400-800°C for 2-8 hours in air).
Step 2: High-Throughput Activity Screening
- Reactor System: Load the catalyst library into a parallel microreactor system where each catalyst spot is addressed individually or as part of a larger array.
- Reaction Conditions: Introduce reactant gases (e.g., CO + O₂ for oxidation, H₂ for hydrogenation) at controlled flow rates, temperatures (200-500°C), and pressures using mass flow controllers.
- Product Detection: Use a rapid-sampling mass spectrometer or a multiplexed gas chromatograph system to analyze effluent from each microreactor in sequence.
- Key Parameter: Measure conversion of key reactant and selectivity to desired product.
Step 3: Data Acquisition and Primary Analysis
- Data Collection: Automate the collection of raw analytical data (e.g., mass spectra, chromatographic peaks) and link them to specific catalyst compositions via a barcoding or positional mapping system [8].
- Data Processing: Convert raw signals into quantitative performance metrics (e.g., % conversion, % selectivity, turnover frequency).
- Quality Control: Apply noise-filtering and curation protocols to flag and exclude data from faulty reactors or contaminated samples [11]. Calculate the Z'-factor for the entire plate to assess assay quality.
- Formula: ( Z' = 1 - \frac{3(\sigmap + \sigman)}{|\mup - \mun|} ), where ( \sigma ) is standard deviation and ( \mu ) is mean of positive (p) and negative (n) controls. An assay with Z' > 0.5 is considered excellent.
Step 4: Hit Identification and Concentration-Response Analysis
- Primary Hit Selection: Rank catalysts based on primary performance metrics (e.g., top 10% by conversion or selectivity).
- Dose-Response Profiling: For selected hits, synthesize and test a series of concentrations or loadings of the active component to establish a concentration-activity relationship.
- Curve Fitting: Fit the activity data to a suitable model (e.g., Hill equation) to extract parameters like AC50 (concentration for half-maximal activity) and Emax (maximal efficacy) [10]. Use the weighted Area Under the Curve (wAUC) as a robust metric for overall performance [11].
- Lead Selection: Prioritize catalysts based on a combination of high efficacy (Emax), high potency (low AC50), and favorable wAUC.
Workflow Visualization and Data Analysis
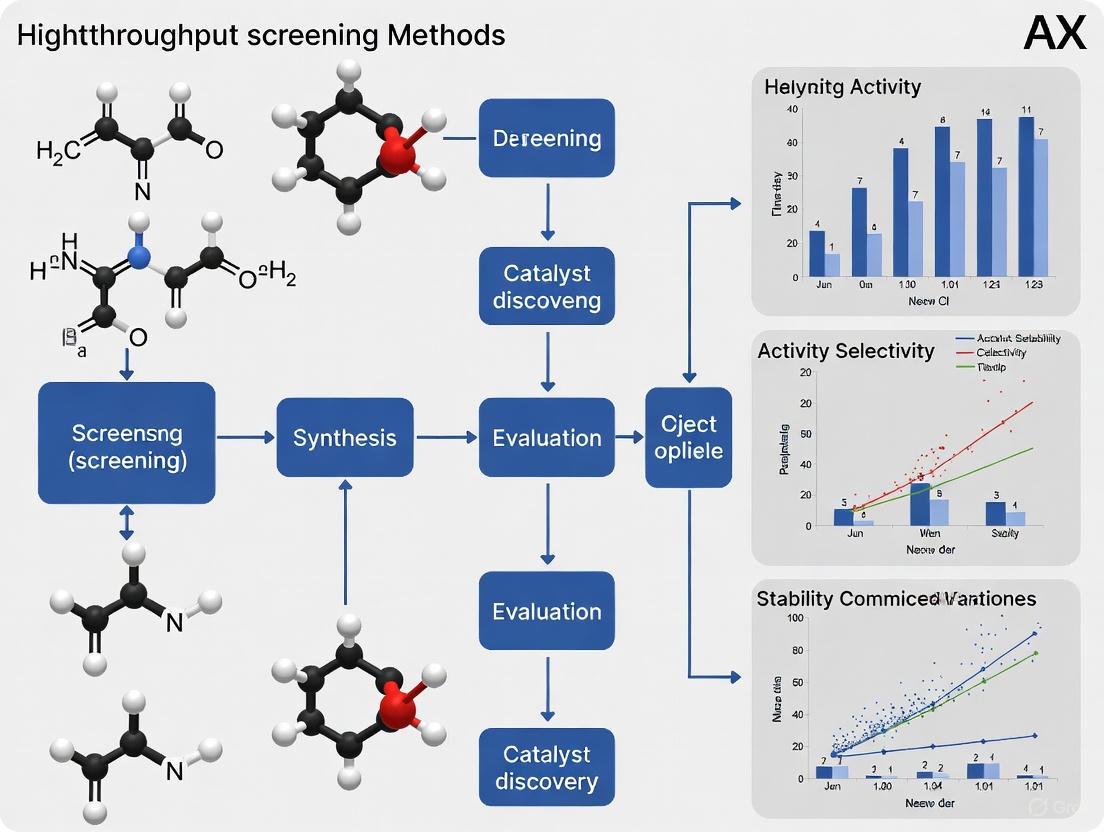
The following diagram illustrates the integrated workflow for a high-throughput screening campaign in catalyst discovery, from library preparation to lead candidate identification.
HTS Workflow for Catalyst Discovery
The Scientist's Toolkit: Essential Research Reagent Solutions
Successful implementation of HTS requires a suite of specialized reagents, materials, and instrumentation. The following table details key solutions essential for establishing a robust HTS pipeline in materials science.
Table 3: Essential Research Reagent Solutions for HTS in Materials Science
| Category | Specific Reagent/Material | Function in HTS Pipeline |
|---|---|---|
| Library Synthesis [8] | Metal Salt Precursors (e.g., Nitrates, Chlorides) | Raw materials for combinatorial synthesis of catalyst libraries. |
| Library Synthesis [12] | Solvent Inks (Water, Ethanol, DMSO) | Vehicles for precise deposition of precursors via inkjet printing or robotic dispensing. |
| Barcoding [8] | Fluorescent Dyes (e.g., Alexa Fluor, Cy series) | Optical labels for tracking material samples or measuring reactions in cell-based assays. |
| Barcoding [8] | DNA Barcode Sequences | Unique molecular identifiers for ultra-high multiplexing of samples, decoded via sequencing. |
| Barcoding [8] | Heavy Metal Isotope Tags (Lanthanides) | Labels for mass cytometry-based detection, enabling high-plex, low-background screening. |
| Assay & Detection [9] | Microplates (96, 384, 1536-well) | Miniaturized platforms for parallel sample processing and analysis. |
| Assay & Detection [9] | Positive Control Compounds | Reference materials for assay validation and normalization of results across plates/runs. |
| Assay & Detection [10] | Detection Reagents (e.g., Luminescent Probes) | Reporters of catalytic activity or material property in a miniaturized format. |
| Data Analysis [11] | wAUC (Weighted Area Under Curve) | A robust quantitative metric for total activity, offering high reproducibility for ranking. |
The urgent need for sustainable energy technologies has placed electrochemical materials discovery at the forefront of scientific research. The traditional iterative approach to material investigation—preparing, testing, and analyzing samples sequentially—is often prohibitively time-consuming, especially given the nearly infinite permutations of potential materials of interest [13]. In response, high-throughput screening (HTS) methodologies have emerged as a powerful alternative, enabling the simultaneous testing of numerous samples in a single experimental setup [13].
Recent analyses reveal a significant paradigm shift: the field is now dominated by computational methods over experimental approaches. A comprehensive review of literature in this domain indicates that over 80% of published studies utilize computational techniques, primarily density functional theory (DFT) and machine learning (ML), with only a minority employing integrated computational-experimental workflows [14]. This review provides a detailed examination of this computational dominance, presenting quantitative analyses, experimental protocols, and visualization tools to guide researchers in leveraging these powerful approaches for accelerated materials discovery, particularly in the context of electrocatalyst development.
Quantitative Analysis of Methodological Distribution
Extensive analysis of current literature reveals distinct patterns in methodological approaches and research focus areas within high-throughput electrochemical materials discovery. The table below summarizes the quantitative distribution of these methodologies and their application areas based on recent publications.
Table 1: Distribution of Research Methodologies in Electrochemical Materials Discovery
| Method Category | Specific Techniques | Approximate Prevalence (%) | Primary Applications |
|---|---|---|---|
| Computational Screening | Density Functional Theory (DFT), Machine Learning (ML) | >80% [14] | Catalyst activity prediction, Stability assessment, Electronic structure analysis |
| Integrated Approaches | Automated setups combining computation & experiment [14] | <20% [14] | Closed-loop material discovery, Experimental validation |
| Experimental HTS | Scanning Electrochemical Microscopy (SECM), Scanning Droplet Cell (SDC) [13] | Minority of studies [14] | Direct performance measurement, Combinatorial library screening |
The research focus is heavily skewed toward certain material classes, creating significant gaps in understanding for other critical components:
Table 2: Research Focus Distribution by Material Type
| Material Type | Research Attention | Key Gaps Identified |
|---|---|---|
| Catalytic Materials | Dominant focus [14] | - |
| Ionomers/Membranes | Significant shortage [14] | Limited HTS studies on conductivity, stability |
| Electrolytes | Significant shortage [14] | Limited HTS studies on electrochemical windows, compatibility |
| Substrate Materials | Significant shortage [14] | Limited HTS studies on support effects, stability |
Furthermore, a critical analysis of screening criteria reveals that most current methodologies overlook crucial economic and safety factors, with fewer studies considering cost, availability, and safety—properties essential for assessing real-world economic feasibility [14].
Computational Methodologies and Protocols
Density Functional Theory (DFT) for Electrocatalysis
Protocol: DFT for Water Splitting Catalyst Evaluation
DFT has become indispensable for rationally designing electrocatalysts by providing atomic-level insights into reaction mechanisms and electronic structures [15]. The following protocol outlines a standardized approach for evaluating water-splitting catalysts (HER and OER):
System Setup
- Model Construction: Build a representative surface model of the catalyst (e.g., slab model for surfaces, cluster for nanoparticles).
- Software Selection: Choose a DFT code (e.g., VASP, Quantum ESPRESSO) with appropriate pseudopotentials and a plane-wave basis set.
- Functional Selection: Select an exchange-correlation functional (e.g., PBE for efficiency, RPBE for improved adsorption energies, HSE06 for hybrid accuracy).
Free Energy Calculation
- Utilize the Computational Hydrogen Electrode (CHE) model to calculate Gibbs free energy changes (ΔG) for reaction intermediates [15].
- Calculate the adsorption energy (ΔEH*) for hydrogen according to your system.
- Apply corrections for Zero-Point Energy (ΔZPE) and entropic effects (TΔS) to determine the final Gibbs free energy of adsorption (ΔGH*) [15]:
ΔG*H* = ΔE*H* + ΔZPE - TΔS
Activity Assessment
- Construct free energy diagrams for both HER and OER at U = 0 V vs. SHE.
- Identify the potential-determining step (PDS) as the step with the largest positive ΔG.
- The theoretical overpotential (η) can be derived from the free energy of the PDS.
This DFT-driven approach not only predicts activities of unsynthesized candidates but also elucidates the origins of observed catalyst performance, bridging the gap between experimental results and theoretical understanding [15].
Machine Learning Integration
Protocol: ML-Accelerated Material Screening
Machine learning models, particularly foundation models, are revolutionizing property prediction by leveraging transferable core components trained on broad data [16]. The following protocol describes their application:
Data Collection and Representation
- Data Sourcing: Extract and curate large-scale data from chemical databases (e.g., PubChem, ZINC, ChEMBL) or scientific literature using automated tools [16].
- Feature Representation: Convert molecular structures into machine-readable formats (e.g., SMILES, SELFIES) or crystal graphs for inorganic solids [16].
Model Selection and Training
- Encoder-Based Models (e.g., BERT architecture): Ideal for property prediction tasks [16].
- Decoder-Based Models (e.g., GPT architecture): Suitable for generative tasks like novel molecular design [16].
- Training Approach: Utilize pre-trained foundation models and fine-tune on specific, smaller datasets for downstream tasks [16].
Validation and Prediction
- Employ cross-validation techniques to assess model performance.
- Use SHAP or similar analysis for model interpretability.
- Integrate predictions with DFT for final validation in a closed-loop discovery pipeline.
This workflow is highly effective for populating large materials databases and enabling inverse design, where desired properties are used to generate candidate structures [16].
Experimental Validation Protocols
High-Throughput Electrochemical Screening
Protocol: Electrochemical HTS for Catalyst Libraries
While computational screening prioritizes candidates, experimental validation remains essential. High-throughput electrochemical screening allows rapid characterization of combinatorial material libraries [13].
Instrumentation Setup
- Core Equipment: Utilize a multichannel potentiostat capable of simultaneous measurements across multiple electrode positions [13].
- Electrode Configuration: Employ a multielectrode array or a scanning droplet cell (SDC) system [13].
- Cell Design: Implement a well-designed electrochemical cell compatible with your sample library format, ensuring minimal cross-talk between channels.
Library Fabrication
- Sample Deposition: Use automated deposition techniques (e.g., inkjet printing, sputtering) to create compositional gradients or discrete sample spots on a conductive substrate.
- Library Design: Plan the library to efficiently explore the compositional space of interest, often guided by prior computational predictions.
Electrochemical Characterization
- Technique Selection: Perform cyclic voltammetry (CV) or linear sweep voltammetry (LSV) across the array to assess activity.
- Data Acquisition: Run automated experiments controlled by software (e.g., using EC-Lab Developer Package) to collect current-voltage data for each library member [13].
- Data Analysis: Automate data processing to extract key metrics (e.g., onset potential, overpotential, current density, Tafel slope) for each sample.
Case Study: Quantitative Voltammetric Analysis
Protocol: Parameter Extraction for Multi-Electron Catalysts
For detailed mechanistic studies, a rigorous quantitative analysis of voltammetric data is essential. This protocol is adapted from studies on multi-redox molecular electrocatalysts [17] and paracetamol [18].
Experimental Conditions
- System: Three-electrode cell (Glassy Carbon working electrode, Pt counter electrode, SCE reference electrode).
- Solution: 1 × 10⁻⁶ M electroactive species (e.g., Paracetamol) with 0.1 M LiClO₄ as supporting electrolyte [18].
- Technique: Cyclic voltammetry at scan rates from 0.025 V/s to 0.300 V/s [18].
Data Analysis Workflow
- Determine Nature of Reaction: Assess peak separation (ΔEp) change with scan rate. An increase indicates quasi-reversible electron transfer [18].
- Calculate Transfer Coefficient (α): Use the Ep − Ep/2 method for reliable results [18].
- Calculate Diffusion Coefficient (D₀): Apply the modified Randles–Ševčík equation, which correlates peak current (Ip) with the square root of scan rate (ν¹ᐟ²) [18].
- Determine Heterogeneous Rate Constant (k₀): Use Kochi and Gileadi methods or a plot of ν⁻¹ᐟ² versus Ψ (from the Nicholson and Shain equation) for quasi-reversible systems [18].
Visualization of Workflows
Computational-Experimental Discovery Pipeline
The following diagram illustrates the integrated high-throughput computational and experimental workflow for accelerated materials discovery, highlighting the dominant role of computational methods.
High-Throughput Screening Classification
This diagram outlines the decision process for selecting the appropriate screening methodology based on research objectives and resources.
The Scientist's Toolkit: Essential Research Reagents and Materials
Successful implementation of high-throughput electrochemical discovery requires specific instrumentation and computational tools. The following table details key solutions and their functions.
Table 3: Essential Research Reagent Solutions for High-Throughput Discovery
| Tool Category | Specific Solution | Function in Research |
|---|---|---|
| Computational Software | DFT Codes (VASP, Quantum ESPRESSO) | Atomic-level calculation of electronic structure, binding energies, and reaction pathways [15]. |
| Machine Learning Frameworks | Chemical Foundation Models (BERT, GPT architectures) | Pre-trained models for property prediction and molecular generation [16]. |
| Electrochemical Instrumentation | Multichannel Potentiostat (e.g., BioLogic) | Simultaneous electrochemical measurement across multiple samples in an array [13]. |
| Scanning Probe Workstations | Scanning Electrochemical Microscope (SECM) | Localized electrochemical measurements on combinatorial libraries with high spatial resolution [13]. |
| Data Extraction & Curation | Named Entity Recognition (NER) Tools | Automated extraction of materials data from scientific literature and patents [16]. |
| Reference Electrodes | Saturated Calomel Electrode (SCE) | Providing a stable, known reference potential in three-electrode experimental setups [18]. |
| Supporting Electrolytes | LiClO₄, KCl, etc. | Conducting current without participating in the electrochemical reaction, minimizing IR drop [18]. |
Application Note: Mapping the Landscape in High-Throughput Catalyst Discovery
High-throughput screening methods are revolutionizing catalyst discovery by accelerating the identification of novel materials. However, significant research gaps persist in both the categories of materials being investigated and the global distribution of research efforts. This application note details these gaps and provides validated experimental protocols to address them, enabling researchers to systematically explore underrepresented areas and foster more inclusive international collaboration.
Table 1: Underrepresented Material Classes in High-Throughput Electrochemical Research [14]
| Material Class | Research Focus Level | Key Unexplored Properties | Potential Impact Area |
|---|---|---|---|
| Ionomers & Membranes | Shortage | Cost, Availability, Safety | Fuel Cells, Electrolysis |
| Electrolytes | Shortage | Durability, Safety | Batteries, Energy Storage |
| Substrate Materials | Shortage | Conductivity, Stability | All Electrochemical Systems |
| Non-Catalytic Materials | Shortage | Multi-property Optimization | System Integration |
| Catalytic Materials | Over 80% of publications [14] | --- | Energy Generation, Chemical Synthesis |
A review of high-throughput methodologies reveals a pronounced imbalance in research focus. Over 80% of publications are concentrated on catalytic materials, creating a significant shortage of research into other crucial material classes essential for full system integration, such as ionomers, membranes, and electrolytes [14]. Furthermore, the screening criteria for new materials often overlook critical economic and safety factors; less than 20% of studies consider cost, availability, and safety in their primary discovery metrics, which are crucial for assessing real-world economic feasibility [14].
Table 2: Global Distribution of High-Throughput Electrochemical Materials Research [14]
| Region/Country | Research Activity Level | Primary Focus Areas | Collaboration Opportunity |
|---|---|---|---|
| United States | High | Catalysts, AI-Driven Discovery | Data Sharing, Policy Alignment |
| Select European Countries | High | Catalysts, Computational Methods | Cross-Border Facilities Access |
| Select Asian Countries | High | Catalysts, Battery Materials | Open Data Initiatives |
| Most Other Countries | Low or None | --- | Capacity Building, Resource Sharing |
The implementation of high-throughput electrochemical materials discovery is geographically concentrated, with research activity confined to a handful of countries [14]. This concentration reveals a substantial global opportunity for collaboration and data sharing to accelerate discovery. Simultaneously, diversity gaps in the scientific workforce present another challenge to innovation. For instance, in the U.S., Hispanic workers make up 17% of the total workforce but only 8% of the STEM workforce, and Black workers comprise 11% of all employed adults but only 9% of those in STEM occupations [19]. These representation gaps are particularly pronounced in fields like engineering and architecture, where Black workers comprise just 5% of the workforce [19].
Experimental Protocols
Protocol 1: High-Throughput Screening of Non-Catalytic Materials
This protocol provides a methodology for extending high-throughput screening to underrepresented material classes such as ionomers, membranes, and electrolytes.
Objective: To establish a reproducible high-throughput workflow for synthesizing and characterizing the properties of non-catalytic electrochemical materials, with integrated assessment of cost and safety.
Materials:
- High-Throughput Synthesizer: For parallel synthesis of material libraries (e.g., combinatorial inkjet printer or automated pipetting system).
- Robotic Characterization Suite: Includes impedance analyzers, gas permeation cells, and mechanical testers.
- Computational Resources: For Density Functional Theory (DFT) calculations and data management.
- Chemical Database: Library of polymer precursors, salts, solvents, and inorganic particles.
Procedure:
- Design of Experiment (DoE):
- Define the compositional space for the target material (e.g., polymer blends for ionomers, salt concentrations for electrolytes).
- Use statistical software to generate a library of distinct compositions for synthesis, ensuring coverage of a wide property space.
Automated Synthesis:
- Program the high-throughput synthesizer to prepare material samples according to the DoE library.
- For ionomer membranes, this may involve automated casting and drying processes in a 96-well format.
Parallel Property Screening:
- Ionic Conductivity: Use a multi-channel impedance analyzer to measure conductivity across all samples.
- Chemical Stability: Expose samples to relevant environments (e.g., acidic/alkaline conditions) in parallel and assess degradation via automated imaging or weight tracking.
- Mechanical Integrity: Perform high-throughput tensile or puncture tests using a robotic system.
Integrated Cost & Safety Analysis:
- Integrate with cost databases of precursor materials to automatically calculate raw material cost per unit.
- Flag compounds containing critical raw materials or substances of very high concern (SVHC) based on regulatory lists.
Data Fusion and Down-Selection:
- Aggregate all property, cost, and safety data into a single database.
- Apply multi-objective optimization algorithms to down-select the top 5-10 candidate materials for further validation.
Protocol 2: Establishing an International Collaborative Screening Pipeline
This protocol outlines a framework for distributing high-throughput screening tasks across international research partners to leverage global expertise and resources.
Objective: To create a standardized and equitable workflow for distributing and reconciling high-throughput computational and experimental tasks among international collaborators.
Materials:
- Cloud-Based Data Platform: A centralized repository for computational models, experimental data, and standard operating procedures (SOPs).
- Standardized Material Kits: Pre-packaged and shipped kits of precursor materials to ensure experimental consistency across labs.
- Communication Infrastructure: Secure video conferencing and project management tools.
Procedure:
- Project Scoping & Task Division:
- Partner laboratories meet to define the research goal and divide the material space (e.g., by elemental composition or material class).
- Clearly assign computational and experimental responsibilities to each partner based on their expertise and infrastructure.
Standardization and Calibration:
- All partners adopt identical computational parameters (e.g., DFT functionals, convergence criteria).
- For experimental work, a "round-robin" test is conducted where all partners analyze the same control sample to calibrate equipment and techniques.
Distributed Execution:
- Computational Hub: One partner manages high-throughput DFT calculations, screening for thermodynamic stability and electronic properties.
- Experimental Hubs: Other partners focus on parallel synthesis and testing based on the computational predictions.
- All data is uploaded to the cloud platform in a pre-defined, standardized format in real-time.
Data Reconciliation and Model Refinement:
- Use machine learning to correlate computational predictions with experimental outcomes from the distributed network.
- Periodically refine the computational models based on the aggregated experimental data to improve prediction accuracy for subsequent screening rounds.
Validation and Intellectual Property (IP) Management:
- The most promising candidates from the distributed screening are validated independently by two or more partners.
- A pre-established IP agreement, defining contribution-based ownership, governs the management of any resulting discoveries.
Workflow Visualization
The Scientist's Toolkit: Research Reagent Solutions
Table 3: Essential Materials for High-Throughput Catalyst Discovery
| Item | Function in Protocol | Example/Note |
|---|---|---|
| Precursor Salt Library | Provides elemental constituents for catalyst synthesis. | e.g., NiCl₂, H₂PtCl₆, AgNO₃ for bimetallic alloys [4]. |
| DFT Calculation Software | Predicts formation energy and electronic structure. | VASP, Quantum ESPRESSO; used for initial stability screening [4]. |
| DOS Similarity Metric | Descriptor for identifying Pd-like catalysts. | Quantifies similarity to reference catalyst (e.g., Pd) [4]. |
| Phase-Change Materials (PCMs) | Thermal energy storage mediums for reactivity studies. | Paraffin wax, salt hydrates [20]. |
| Automated Synthesis Robot | Enables parallel synthesis of material libraries. | Crucial for creating compositional spreads for screening [14]. |
| Cloud Data Platform | Centralized repository for collaborative data sharing. | Essential for international collaboration pipelines [14]. |
| Standardized Material Kits | Ensures experimental consistency across partner labs. | Pre-measured precursors shipped to all collaborators. |
The Role of Autonomous Labs and Closed-Loop Discovery Processes
Autonomous laboratories, often termed "self-driving labs," represent a paradigm shift in scientific research, particularly in catalyst discovery and materials science. These systems integrate artificial intelligence (AI), robotic experimentation, and automation technologies into a continuous closed-loop cycle, enabling the execution of scientific experiments with minimal human intervention [21]. This approach fundamentally accelerates the exploration of vast chemical and material spaces, which is critical for developing sustainable technologies and new therapeutics.
The core of an autonomous lab is a closed-loop experimental cycle where AI generates hypotheses, robotic systems execute experiments, and data analysis algorithms interpret results to inform the next cycle of experimentation [21] [22]. This continuous process minimizes downtime between experiments, eliminates subjective decision points, and enables rapid optimization strategies. For catalyst discovery—a field traditionally characterized by time-intensive trial-and-error approaches—this autonomous paradigm reduces discovery timelines from years to days or weeks [21] [23].
Table 1: Impact Assessment of Autonomous Laboratory Implementation
| Metric | Traditional Approach | Autonomous Lab Approach | Reference |
|---|---|---|---|
| Experiment Throughput | 20-30 screens/quarter | 50-85 screens/quarter | [24] |
| Condition Evaluation | <500 conditions/quarter | ~2000 conditions/quarter | [24] |
| Material Discovery Rate | Months to years | Weeks | [21] [23] |
| Development Cost Reduction | Baseline | ~25% reduction | [22] |
| R&D Cycle Time | Baseline | Reduction by >500 days | [22] |
Core Components and Technologies
Architectural Framework
Autonomous laboratories feature a modular architecture that physically and computationally integrates several key components. The hardware layer typically includes robotic automation systems (liquid handlers, mobile sample transport robots), analytical instruments (mass spectrometers, plate readers, NMR), and environmental control modules (incubators, gloveboxes) [25]. A notable feature of advanced systems like the Autonomous Lab (ANL) is their modular design with devices installed on movable carts, allowing reconfiguration to suit specific experimental needs [25].
The software layer consists of AI planning algorithms, data analysis tools, and integration middleware that controls hardware components. This layered architecture creates a continuous workflow where AI-driven experimental design directly interfaces with robotic execution systems, and analytical data feeds back to optimization algorithms [21] [25].
AI and Machine Learning Technologies
Artificial intelligence serves as the "brain" of autonomous laboratories, with several specialized technologies enabling closed-loop operation:
Experimental Planning and Optimization: AI systems employ algorithms such as Bayesian optimization to design experiments that efficiently explore parameter spaces. For instance, the ANL system used Bayesian optimization to adjust concentrations of medium components to maximize cell growth and glutamic acid production in E. coli [25]. Reinforcement learning further enables adaptive control based on experimental outcomes.
Large Language Models (LLMs): Systems like Coscientist and ChemCrow utilize LLMs with tool-using capabilities to plan and execute complex chemical experiments. These systems can design synthetic routes, control robotic hardware, and analyze results [21]. ChemAgents employs a hierarchical multi-agent system with role-specific agents (Literature Reader, Experiment Designer, etc.) coordinated by a central Task Manager [21].
Data Analysis and Interpretation: Machine learning models, including convolutional neural networks, process analytical data from various characterization techniques. The A-Lab system used ML models for precursor selection and X-ray diffraction phase analysis, enabling real-time interpretation of experimental outcomes [21].
Cross-Domain Foundation Models: Emerging AI approaches use foundation models trained on diverse scientific data to predict material properties and propose synthesis routes, creating synergy between computational prediction and experimental validation [22] [23].
Figure 1: Closed-loop workflow in autonomous laboratories showing the continuous cycle of AI-driven design, robotic execution, analytical measurement, and data-driven learning.
Application Notes for Catalyst Discovery
High-Throughput Computational-Experimental Screening
The integration of high-throughput computational screening with experimental validation has proven highly effective for discovering novel bimetallic catalysts. In one representative study, researchers developed a protocol to identify Pd-replacement catalysts using electronic density of states (DOS) similarity as a screening descriptor [4]. The workflow began with first-principles calculations screening 4,350 bimetallic alloy structures, followed by experimental validation of top candidates.
The computational phase employed density functional theory (DFT) to calculate formation energies and DOS patterns for each alloy. The similarity between each candidate's DOS pattern and that of Pd(111) surface was quantified using a specialized metric that applied greater weight to regions near the Fermi energy [4]. This approach identified eight promising candidates from the initial library, four of which demonstrated catalytic performance comparable to Pd in experimental testing for H2O2 direct synthesis. Notably, the Pd-free Ni61Pt39 catalyst exhibited a 9.5-fold enhancement in cost-normalized productivity compared to Pd [4].
Table 2: Performance Metrics for Selected Catalysts from High-Throughput Screening
| Catalyst | DOS Similarity to Pd | H2O2 Synthesis Performance | Cost-Normalized Productivity |
|---|---|---|---|
| Pd (Reference) | 0 (by definition) | Baseline | 1.0 (Baseline) |
| Ni61Pt39 | Low | Comparable to Pd | 9.5x enhancement |
| Au51Pd49 | Low | Comparable to Pd | Not specified |
| Pt52Pd48 | Low | Comparable to Pd | Not specified |
| Pd52Ni48 | Low | Comparable to Pd | Not specified |
Fluorogenic High-Throughput Kinetic Screening
For catalyst discovery and kinetic profiling, researchers have developed automated, real-time optical scanning approaches that leverage fluorogenic probes. One innovative platform screened 114 different catalysts for nitro-to-amine reduction using a simple "on-off" fluorescence probe that produces a strong fluorescent signal when the non-fluorescent nitro-moiety is reduced to its amine form [26].
This system utilized 24-well polystyrene plates with each reaction well containing catalyst, fluorogenic probe, and reagents, paired with reference wells containing the final amine product. A plate reader performed orbital shaking followed by fluorescence and absorption scanning every 5 minutes for 80 minutes, generating time-resolved kinetic data for each catalyst [26]. This approach collected over 7,000 data points, enabling comprehensive assessment of catalyst performance based on reaction completion times, selectivity, and the presence of intermediates.
The methodology enabled multidimensional evaluation incorporating not just catalytic activity but also material abundance, price, recoverability, and safety. The integration of environmental considerations directly into the screening process promotes selection of sustainable catalytic materials, moving beyond pure performance metrics [26].
Experimental Protocols
Protocol 1: High-Throughput Screening of Bimetallic Catalysts Using DOS Similarity
Objective: Identify bimetallic catalysts with performance comparable to precious metal catalysts using computational-experimental screening.
Materials:
- DFT computation cluster
- High-throughput synthesis platform
- Catalyst testing reactor system
- Analytical equipment (HPLC, GC-MS)
Procedure:
Computational Screening Phase:
- Select binary systems from transition metals in periods IV, V, and VI (435 binary systems at 1:1 composition) [4].
- For each system, evaluate 10 ordered crystal structures (B1, B2, B3, B4, B11, B19, B27, B33, L10, L11), totaling 4,350 structures.
- Calculate formation energy (ΔEf) for each structure using DFT. Filter systems with ΔEf < 0.1 eV to ensure thermodynamic stability.
- For thermodynamically stable alloys, compute density of states (DOS) patterns projected on close-packed surfaces.
- Quantify similarity to reference catalyst (e.g., Pd(111)) using ΔDOS metric with Gaussian weighting (σ = 7 eV) near Fermi energy [4].
- Select top candidates with lowest ΔDOS values for experimental validation.
Experimental Validation Phase:
- Synthesize selected bimetallic catalysts using appropriate methods (impregnation, co-precipitation, etc.).
- Evaluate catalytic performance for target reaction (e.g., H2O2 direct synthesis) under standardized conditions.
- Compare activity, selectivity, and stability to reference catalyst.
- Calculate cost-normalized productivity considering catalyst composition and precious metal content.
Troubleshooting:
- For immiscible elements with positive ΔEf, consider nonequilibrium synthesis methods.
- If experimental performance doesn't correlate with DOS similarity, verify surface composition matches computational models.
Protocol 2: Real-Time Fluorogenic Kinetic Screening of Catalyst Libraries
Objective: Simultaneously screen multiple catalysts for reduction reactions using real-time fluorescence monitoring.
Materials:
- 24-well polystyrene plates
- Nitronaphthalimide (NN) fluorogenic probe
- Catalyst library (114 catalysts)
- Biotek Synergy HTX multi-mode plate reader
- Aqueous N2H4 (1.0 M)
- Acetic acid (0.1 mM)
Procedure:
Plate Setup:
- Prepare reaction wells: each contains 0.01 mg/mL catalyst, 30 µM NN, 1.0 M aqueous N2H4, 0.1 mM acetic acid, H2O (total volume 1.0 mL) [26].
- Prepare reference wells: identical composition but with NN replaced by reduced amine product (AN).
- Arrange plate with 12 reaction wells and 12 corresponding reference wells.
Kinetic Data Collection:
- Initiate reactions simultaneously.
- Place plate in pre-programmed multi-mode reader.
- Set cycle: 5 seconds orbital shaking → fluorescence scan (excitation 485 nm, emission 590 nm) → absorption spectrum (300-650 nm) [26].
- Repeat cycle every 5 minutes for 80 minutes.
- For fast-reacting systems, implement fast kinetics protocol with additional early timepoints.
Data Processing:
- Convert raw data to CSV format and import to database.
- Generate kinetic graphs for each catalyst: absorption decay at 350 nm (nitro form), growth at 430 nm (amine product), fluorescence intensity, and isosbestic point stability.
- Calculate reaction rates, completion times, and selectivity based on intermediate formation.
Catalyst Scoring:
- Evaluate catalysts based on multiple criteria: reaction completion time, material abundance, price, recoverability, and safety.
- Apply weighting factors emphasizing green chemistry principles where appropriate.
- Rank catalysts by cumulative score for further development.
Troubleshooting:
- If isosbestic point not stable, suspect side reactions or intermediate accumulation.
- For low fluorescence signal, verify probe concentration and catalyst dispersion.
Figure 2: Integrated computational-experimental screening protocol for accelerated catalyst discovery, showing the continuous feedback between simulation and validation.
The Scientist's Toolkit: Essential Research Reagents and Materials
Table 3: Key Research Reagent Solutions for Autonomous Catalyst Screening
| Reagent/Material | Function | Application Example | Technical Notes |
|---|---|---|---|
| Nitronaphthalimide (NN) probe | Fluorogenic substrate for reduction reactions | Real-time kinetic screening of nitro-to-amine reduction catalysts [26] | Exhibits shift in absorbance and strong fluorescence upon reduction to amine form |
| Bimetallic alloy libraries | Catalyst candidates for high-throughput screening | Discovery of Pd-replacement catalysts for H2O2 synthesis [4] | Pre-screened for thermodynamic stability (ΔEf < 0.1 eV) |
| Aqueous hydrazine (N2H4) | Reducing agent for catalytic reduction reactions | Nitro-to-amine reduction screening platform [26] | Used at 1.0 M concentration in fluorogenic assay |
| M9 minimal medium | Defined growth medium for microbial biocatalyst studies | Optimization of E. coli culture conditions for glutamic acid production [25] | Enables precise control of nutrient concentrations during bioprocess optimization |
| Bayesian optimization algorithms | AI-driven experimental planning and parameter optimization | Autonomous optimization of culture medium components [25] | Efficiently explores multi-dimensional parameter spaces with minimal experiments |
| Modular robotic platforms (e.g., CHRONECT XPR) | Automated solid and liquid handling for HTE | High-throughput catalyst screening at AstraZeneca [24] | Enables dosing of 1 mg to several grams with <10% deviation at low masses |
Implementation Considerations and Challenges
While autonomous laboratories offer transformative potential for catalyst discovery, several practical challenges must be addressed for successful implementation. Data quality and scarcity present significant hurdles, as AI models require high-quality, diverse training data, while experimental data often suffer from noise and inconsistent sources [21]. Developing standardized experimental data formats and utilizing high-quality simulation data with uncertainty analysis can help mitigate these issues.
Hardware integration remains challenging due to the diverse instrumentation requirements for different chemical tasks. Solid-phase synthesis necessitates furnaces and powder handling, while organic synthesis requires liquid handling and NMR [21]. Developing standardized interfaces that accommodate rapid reconfiguration of different instruments is essential for flexible autonomous systems.
AI model generalization is another critical challenge, as most autonomous systems and AI models are highly specialized for specific reaction types or material systems. Transfer learning and meta-learning approaches can help adapt models to new domains with limited data [21]. Additionally, LLM-based decision-making systems sometimes generate plausible but incorrect chemical information, necessitating targeted human oversight during development [21].
Successful implementation, as demonstrated by AstraZeneca's 20-year HTE journey, requires close collaboration between automation specialists and domain scientists. Colocating these experts enables a cooperative rather than service-led approach, fostering innovation and practical problem-solving [24].
Implementing High-Throughput Screening: Computational and Experimental Approaches
The discovery and development of advanced materials, particularly catalysts, are pivotal for addressing global challenges in sustainable energy and green chemical production. Traditional research paradigms, reliant on empirical trial-and-error or theoretical simulations alone, are increasingly limited by inefficiencies when navigating vast chemical spaces [27]. The integration of Density Functional Theory (DFT) and Machine Learning (ML) has emerged as a transformative approach, creating accelerated, high-throughput workflows for catalyst discovery [14] [28]. This paradigm leverages the physical insights of first-principles computations with the pattern recognition and predictive power of data-driven models, enabling the rapid screening and design of novel materials with tailored properties [27]. This document outlines detailed application notes and protocols for implementing these integrated computational workflows, framed within the context of high-throughput screening for catalyst discovery research.
Foundational Concepts and Synergies
The Distinct Roles of DFT and ML
In integrated workflows, DFT and ML are not competing tools but complementary technologies that address each other's limitations.
- Density Functional Theory (DFT) serves as a high-fidelity data generator. It provides quantum-mechanical-level calculations of material properties, such as formation energies, electronic band structures, and adsorption energies of reaction intermediates [28] [29]. While highly insightful, DFT is computationally expensive, making exhaustive screening of large material databases prohibitive.
- Machine Learning (ML) acts as a fast, surrogate model. ML algorithms are trained on datasets derived from DFT calculations (or experiments) to learn the complex relationships between a material's composition, structure, and its properties [28] [27]. Once trained, an ML model can predict material properties instantaneously and at a fraction of the computational cost of DFT, enabling rapid exploration of vast chemical spaces.
Techniques for Integration
The synergy between DFT and ML is achieved through several technical approaches:
- Descriptor-Based Prediction: ML models use features (descriptors) derived from a material's composition (e.g., elemental concentrations, atomic numbers) or structure (e.g., symmetry, radial distribution functions) to predict target properties like catalytic activity or stability [27] [30].
- Machine Learning Interatomic Potentials (MLIPs): MLIPs are trained on DFT-generated energies and forces to create potentials that approach the accuracy of DFT but with the computational speed of classical force fields, enabling large-scale molecular dynamics simulations [28].
- Error Correction: ML can be employed to correct systematic errors in DFT. For instance, neural networks can learn the discrepancy between DFT-calculated and experimentally measured properties (e.g., formation enthalpies), thereby improving the reliability of first-principles predictions [30].
Application Notes and Protocols
This section provides a detailed, step-by-step methodology for a representative high-throughput screening workflow aimed at discovering novel solid-state catalysts.
Protocol 1: High-Throughput Screening of Catalytic Materials
Aim: To systematically identify promising catalyst candidates for a target reaction (e.g., hydrogen evolution reaction) from a large space of ternary alloys.
Workflow Overview: The following diagram illustrates the integrated DFT and ML screening pipeline.
Detailed Methodology:
Step 1: Define the Exploration Space and Initial Data Generation
- Objective: Select a constrained chemical space (e.g., Al-Ni-Pd ternary system) and generate an initial dataset for ML training [30].
- Procedure:
- Curate a list of potential binary and ternary compounds and alloys from existing materials databases.
- Perform high-throughput DFT calculations for these structures to compute key properties. Essential properties for catalysis include:
- Utilize high-throughput computational frameworks, ensuring consistent calculation parameters (e.g., k-point mesh, exchange-correlation functional) across all systems.
Step 2: Construct a Structured Materials Database
- Objective: Assemble DFT results into a structured and labeled database.
- Procedure:
- For each material, store its composition, crystal structure, and the computed DFT properties.
- Generate a set of machine-readable descriptors. Initial features can include:
- Normalize all features to prevent scaling biases in the ML model.
Step 3: Train Machine Learning Models
- Objective: Develop accurate surrogate models to predict material properties.
- Procedure:
- Model Selection: Begin with tree-based models (e.g., XGBoost) or neural networks (Multi-layer Perceptrons) for regression tasks [27] [30].
- Training: Use the structured database to train models to predict a target property (e.g., adsorption energy) from the input descriptors.
- Validation: Implement rigorous validation techniques such as k-fold cross-validation and leave-one-out cross-validation (LOOCV) to prevent overfitting and ensure model generalizability [27] [30].
- Evaluation: Assess model performance using metrics like Mean Absolute Error (MAE) and Root Mean Square Error (RMSE) against a held-out test set.
Step 4: High-Throughput Screening and Validation
- Objective: Use the trained ML model to screen a vast virtual library of materials and validate top candidates.
- Procedure:
- Apply the ML model to predict the properties of thousands to millions of candidate materials within the defined chemical space.
- Filter and rank candidates based on desired property thresholds (e.g., high stability, optimal adsorption energy).
- Select the top-ranking candidates and perform higher-fidelity DFT calculations to validate the ML predictions. This step confirms the results and filters out false positives.
- The most promising candidates from DFT validation are recommended for experimental synthesis and testing.
Protocol 2: ML-Augmented DFT for Accurate Phase Stability
Aim: To improve the accuracy of DFT-predicted formation enthalpies and phase stability in ternary alloy systems using a neural network-based error correction method [30].
Workflow:
Step 1: Data Curation
- Compile a dataset of binary and ternary alloys with both DFT-calculated and experimentally measured formation enthalpies (Hf).
- Filter the data to exclude unreliable or missing values.
Step 2: Error Learning
- The target variable for the ML model is the error, defined as: ( \Delta Hf = H{f}^{(\text{exp})} - H_{f}^{(\text{DFT})} ).
- Train a neural network (e.g., a Multi-layer Perceptron with three hidden layers) to predict ( \Delta H_f ) using the same structured feature set described in Protocol 1 [30].
Step 3: Prediction and Correction
- For a new material, calculate ( H{f}^{(\text{DFT})} ) and use the trained NN to predict the error ( \Delta Hf^{(\text{pred})} ).
- The corrected, more accurate formation enthalpy is: ( H{f}^{(\text{corrected})} = H{f}^{(\text{DFT})} + \Delta H_f^{(\text{pred})} ).
- This corrected value is then used for constructing accurate phase diagrams and assessing phase stability.
The Scientist's Toolkit: Essential Research Reagents and Computational Solutions
The following table details key software and computational methods that form the essential "reagent solutions" for implementing integrated DFT-ML workflows.
Table 1: Key Research Reagent Solutions for DFT-ML Workflows
| Software/Method | Category | Primary Function | Key Application in Workflows |
|---|---|---|---|
| VASP [29] | DFT Code | Planewave-based electronic structure calculations. | High-throughput computation of formation energies, band structures, and adsorption energies for database generation. |
| Quantum ESPRESSO [29] | DFT Code | Open-source suite for DFT and molecular dynamics. | An accessible alternative for performing first-principles calculations in automated workflows. |
| XGBoost [27] | ML Algorithm | Supervised learning using gradient-boosted decision trees. | Rapid and accurate prediction of material properties from descriptors; often used for initial screening. |
| Multi-layer Perceptron (MLP) [30] | ML Algorithm | A class of feedforward artificial neural network. | Modeling complex, non-linear relationships in materials data, such as error correction in formation enthalpies. |
| SISSO [27] | ML Method | Compressed-sensing for identifying optimal descriptors. | Ascertaining the most relevant physical descriptors from a huge pool of candidate features. |
| Machine Learning Interatomic Potentials (MLIPs) [28] | ML Method | Potentials trained on DFT data for fast, accurate MD. | Enabling large-scale and long-time-scale simulations of catalytic surfaces and reaction dynamics. |
Quantitative Data and Performance Metrics
The efficacy of integrated DFT-ML workflows is demonstrated by key performance metrics, including accuracy and computational speed-up.
Table 2: Quantitative Performance of DFT-ML Workflows in Catalysis Research
| Application Domain | ML Model Used | Key Performance Metric | Result / Impact |
|---|---|---|---|
| Catalyst Screening [27] | Graph Neural Networks, Random Forest | High-accuracy prediction of adsorption energies. | Achieves predictive accuracy comparable to DFT at a fraction of the computational cost, enabling vast chemical space exploration. |
| Phase Stability [30] | Neural Network (MLP) | Mean Absolute Error (MAE) in formation enthalpy. | Significantly reduces error in DFT-predicted formation enthalpies for Al-Ni-Pd and Al-Ni-Ti systems, improving phase diagram reliability. |
| Band Gap Prediction [28] | Models trained on DFT data | Prediction accuracy vs. computational cost. | Predicts electronic properties with high accuracy at reduced computational costs, expanding the scope of screenable chemistries. |
| Workflow Efficiency [14] | Hybrid DFT/ML/Experiment | Acceleration of discovery timeline. | Closed-loop autonomous labs integrate computation, experiment, and AI to drastically reduce the time from hypothesis to new material identification. |
The exploration of complex chemical spaces for catalyst discovery necessitates a paradigm shift from traditional, labor-intensive experimental methods. Advanced High-Throughput Screening (HTS) platforms that integrate automation, miniaturization, and data science are now at the forefront of this transformation [31] [32]. These systems are specifically engineered to manage the high-dimensionality of material design spaces, which is a task that surpasses human capability for efficient exploration. By leveraging technologies such as microfluidics and automated robotics, these platforms enable the rapid and cost-effective screening of thousands of candidate materials or compounds, dramatically accelerating the innovation cycle [33] [32].
The integration of Artificial Intelligence (AI) and machine learning (ML) forms the intellectual core of modern HTS, creating a powerful feedback loop for experimental design and data analysis [31] [32]. This synergy is particularly potent in electro-catalyst discovery, where active learning techniques like Bayesian optimization guide the iterative process of proposing new experiments, synthesizing candidates, and characterizing their performance for reactions such as oxygen evolution, hydrogen evolution, and CO2 reduction [31]. Consequently, these platforms not only expedite the discovery of novel high-performance materials but also facilitate the extraction of fundamental chemistry-structure-property relationships that were previously inaccessible [31].
Microfluidic HTS Platforms
Microfluidic HTS revolutionizes traditional screening by miniaturizing and parallelizing laboratory processes onto a single chip. These systems manipulate tiny fluid volumes (often below 10 µl) within microscale channels and chambers to perform rapid, highly controlled experiments [10] [33]. The core strength of microfluidics lies in its ability to precisely deliver reagents, control local environmental conditions (e.g., temperature, pressure), and monitor reactions in real-time, all while operating with minimal reagent consumption [33]. This precision leads to more reliable and reproducible results compared to conventional methods. Furthermore, microfluidic devices can be designed to create conditions that closely mimic real biological or catalytic environments, thereby enhancing the physiological relevance of screening outcomes for biomedical and catalytic applications [33]. The technology is a cornerstone for the ongoing development of targeted, personalized therapies and efficient catalyst discovery.
Automated Robotic Assay Systems
Automated robotic systems represent a physical integration platform, combining robotic liquid handlers, automated synthesis reactors, and high-sensitivity detectors to execute extensive experimental workflows with minimal human intervention [31] [32]. A key application is Quantitative HTS (qHTS), which involves assaying complete compound libraries across a series of dilutions to generate full concentration-response profiles for every substance [10] [34]. These platforms operate reliably in high-density plate formats (e.g., 1536-well plates), enabling the vertical development of inter-plate titration series [34]. The true transformative power of these systems is unlocked when they are coupled with AI. This integration gives rise to autonomous or "self-driving" laboratories, often termed AI chemists or robotic AI chemists [32]. These systems can autonomously execute tasks ranging from the theoretical design of catalyst components and the optimization of synthesis conditions to high-throughput preparation and performance testing, effectively closing the loop between data acquisition and experimental decision-making [32].
Platform Comparison Table
The following table summarizes the key characteristics of these two HTS platform types.
Table 1: Comparative Analysis of Microfluidic and Automated Robotic HTS Platforms
| Feature | Microfluidic HTS Platforms [33] | Automated Robotic Assay Systems [31] [10] [34] |
|---|---|---|
| Throughput | High, enabled by massive parallelization on a single chip. | High, enabled by robotic automation of standard plate-based assays. |
| Sample Volume | Very low (e.g., <10 µl per test). | Low (e.g., <10 µl per well in 1536-well plates). |
| Key Strengths | High precision control, low cost per test, mimics real environments. | High reliability, flexibility for complex workflows, seamless integration with AI. |
| Primary Applications | Drug screening, biomolecule analysis, condition optimization. | qHTS, catalyst discovery and optimization, electrolyte screening. |
| Automation & AI Integration | Platform for controlled data generation; can be part of a larger automated system. | Core component for creating closed-loop, autonomous discovery systems (AI chemists). |
Experimental Protocols
Protocol for Quantitative HTS (qHTS) in Catalyst Discovery
This protocol outlines the process for performing a qHTS assay to evaluate a library of catalyst candidates, adapted for automated systems [10] [34].
Step 1: Compound Library and Plate Preparation
- Prepare a master library of catalyst precursors or compounds in a 384-well format.
- Using an automated liquid handler, create an inter-plate dilution series to generate a range of concentrations for each compound.
- Reformulate and compress this dilution series into a suite of 1536-well assay plates for screening. Register and track all plates in a laboratory information management system (LIMS) [34].
Step 2: Assay Execution and Reaction Monitoring
- Transfer the prepared 1536-well assay plates to an automated robotic platform equipped with high-sensitivity detectors.
- Initiate the catalytic reaction (e.g., oxygen evolution, CO2 reduction) by adding relevant substrates and reactants under controlled atmospheric conditions (e.g., inert gas) [31].
- Monitor the reaction in real-time, measuring relevant response metrics (e.g., gas evolution, current density, product formation).
Step 3: Data Acquisition and Concentration-Response Modeling
- For each catalyst candidate, collect response data across all tested concentrations.
- Fit the concentration-response data to a non-linear model, such as the Hill Equation (Logistic Form) [10]:
Ri = E0 + (E∞ - E0) / [1 + exp{-h(log Ci - log AC50)}]Ri: Measured response at concentrationCiE0: Baseline responseE∞: Maximal responseAC50: Concentration for half-maximal response (potency indicator)h: Shape (Hill) parameter [10]
- Extract and record the parameters (
AC50,E∞,h) for each compound.
Step 4: Data Analysis and Hit Identification
- Rank catalysts based on the estimated parameters, primarily using
AC50for potency andEmax(calculated asE∞ - E0) for efficacy [10]. - Account for parameter estimate uncertainty, which can be high if the concentration range fails to define asymptotes or with suboptimal spacing [10].
- Classify candidates as "active" or "inactive" using robust statistical methods to minimize false positives/negatives [10].
- Rank catalysts based on the estimated parameters, primarily using
Protocol for AI-Driven Closed-Loop Catalyst Synthesis and Screening
This protocol describes an advanced workflow for the autonomous discovery of catalysts, integrating AI, automated synthesis, and HTS into a closed-loop system [32].
Step 1: Goal Definition and Initial Dataset Curation
- Define the primary objective for the target catalyst (e.g., "maximize Faradaic efficiency for CO2-to-ethanol conversion at ≤ 0.5 V overpotential").
- Curate a seed dataset from existing scientific literature, computational simulations, or prior experimental results to train initial machine learning models [32].
Step 2: ML-Guided Candidate Design and Synthesis Optimization
- The AI system uses ML algorithms (e.g., Bayesian optimization, neural networks) to analyze the seed data and predict promising catalyst compositions and structures.
- Simultaneously, the model optimizes the synthesis conditions for the proposed candidates, including precursors, temperature, time, and solvent environment [32].
- The system outputs a list of candidate materials and their optimized synthesis recipes.
Step 3: Automated High-Throughput Synthesis and Characterization
- The robotic AI chemist executes the synthesis recipes autonomously within an integrated automated platform [32].
- The synthesized materials are automatically transferred to a characterization module. Techniques such as microscopy or spectroscopy may be used to provide feedback on the success of the synthesis and the resulting material properties [32].
Step 4: High-Throughput Performance Screening
Step 5: Active Learning and Iterative Loop Closure
- The newly generated experimental data (from synthesis, characterization, and performance screening) is fed back into the ML model.
- The model is retrained on this expanded dataset, improving its predictive accuracy.
- The AI then proposes a new set of refined experiments or candidate materials, closing the loop and initiating the next cycle of discovery without the need for human intervention [32].
Workflow Visualization
The following diagram illustrates the integrated, closed-loop workflow of an AI-driven experimental platform for catalyst discovery.
The Scientist's Toolkit: Essential Research Reagent Solutions
The successful implementation of HTS platforms relies on a suite of essential reagents, materials, and tools. The following table details key components for a typical HTS campaign in catalyst discovery and related fields.
Table 2: Key Research Reagent Solutions for HTS Platforms
| Item | Function & Application |
|---|---|
| Compound Libraries | Collections of thousands of small molecules or catalyst precursors; the source of diversity for screening in qHTS to generate concentration-response profiles [10] [34]. |
| Assay-Specific Substrates & Reagents | Chemical reactants and detection reagents specific to the catalytic reaction of interest (e.g., CO2 for reduction, water for oxidation); used to measure catalytic activity and selectivity [31]. |
| Cell-Based Assay Systems (for biomedical context) | In vitro cellular systems (e.g., 1536-well plates with <10 µl per well) used in qHTS as alternatives for toxicity testing or drug mechanism studies [10]. |
| Surface & Structure-Directing Agents | Chemical additives (e.g., surfactants, capping agents) used in AI-optimized synthesis protocols to control the morphology and surface structure of catalyst nanoparticles [32]. |
| High-Fidelity Ligands & Precursors | Molecular and solid-state precursors with defined purity; essential for the reproducible, robotic synthesis of proposed catalyst materials guided by ML [32]. |
| Lineage & Activation Markers (for immunophenotyping) | Antibodies against CD molecules (e.g., CD3, CD14, CD69); used in flow cytometry to identify, characterize, and quantify specific immune cell populations in mixed samples [35]. |
The integration of machine learning (ML) into catalysis research represents a transformative shift from traditional, often empirical methods towards a data-driven paradigm that significantly accelerates discovery. This is particularly critical within the context of high-throughput screening, which aims to efficiently navigate vast chemical spaces for novel catalyst formulations. The traditional approaches of trial-and-error experimentation and computationally intensive density functional theory (DFT) calculations often struggle with the multidimensional nature of catalyst design and the sheer scale of possible material combinations [36] [37]. Machine learning emerges as a powerful solution, leveraging its predictive capabilities to lower computational costs, reduce experimental workload, and uncover complex, non-linear structure-activity relationships that are difficult to discern through conventional means [38] [36].
The foundation of any successful ML application in catalysis rests on two critical pillars: the selection of appropriate algorithms and, more importantly, the definition of accurate and meaningful catalytic descriptors [37]. Descriptors are quantitative representations of reaction conditions, catalysts, and reactants that translate real-world properties into a machine-readable format, thereby playing a decisive role in the predictive accuracy of the resulting models [37]. This protocol outlines a comprehensive framework for implementing ML in catalysis, from initial data acquisition to final predictive modeling, providing researchers with a structured approach to leverage these powerful tools.
Machine Learning Workflow for Catalysis
The application of machine learning in catalysis follows a structured pipeline that transforms raw data into predictive insights and actionable hypotheses. The diagram below illustrates the core workflow, integrating both computational and experimental data streams.
Figure 1: The ML catalyst discovery workflow integrates diverse data sources, from computational to experimental, guiding the iterative process from problem definition to experimental validation.
Data Acquisition and Curation Protocols
Protocol: Acquiring Computational Data via Machine-Learned Force Fields
Purpose: To generate large-scale, accurate adsorption energy data for catalyst screening, bypassing the computational cost of DFT.
Background: Density functional theory, while accurate, is computationally prohibitive for screening thousands of materials. Machine-learned force fields (MLFFs) offer a solution, providing quantum-mechanical accuracy with a speed-up factor of 10^4 or more [38].
Materials & Data Sources:
- Open Catalyst Project (OCP) Database: A comprehensive source of DFT calculations for training MLFFs [38].
- Materials Project Database: For obtaining initial crystal structures of stable and experimentally observed metals and alloys [38].
- OCP equiformer_V2 MLFF: A pre-trained model for rapid energy calculations [38].
Methodology:
- Search Space Definition: Select metallic elements based on prior experimental relevance and their presence in the OC20 database (e.g., K, V, Mn, Fe, Co, Ni, Cu, Zn, Ru, Rh, Pd, Pt, Au) [38].
- Bulk Structure Optimization: Query the Materials Project for stable crystal structures of these elements and their bimetallic alloys. Perform bulk DFT optimization (e.g., at the RPBE level) to align with OCP data.
- Surface Generation: Use tools (e.g., from the
fairchemrepository) to create low-energy surface terminations for facets with Miller indices ∈ {−2, −1, 0, 1, 2} [38]. - Adsorbate Configuration: Engineer surface-adsorbate configurations for key reaction intermediates (e.g., for CO₂ to methanol: *H, *OH, *OCHO, *OCH₃) on the most stable surface terminations.
- Energy Calculation: Optimize these configurations using the OCP MLFF to obtain adsorption energies.
- Validation: Benchmark the MLFF-predicted adsorption energies against explicit DFT calculations for a select subset of materials (e.g., Pt, Zn, NiZn) to ensure reliability. The target mean absolute error (MAE) should be ≤ 0.2 eV [38].
Protocol: Mining Literature Data with Language Models
Purpose: To rapidly extract structured synthesis protocols from unstructured text in scientific literature, accelerating literature review and data collection.
Background: Keeping pace with literature is time-intensive. Transformer models can automate the extraction of synthesis steps and parameters, reducing literature analysis time by over 50-fold [39].
Materials & Data Sources:
- ACE (sAC transformEr) Model: A fine-tuned transformer model for converting heterogeneous catalysis synthesis paragraphs into machine-readable action sequences [39].
- Annotation Software: For manually defining and labeling action terms (e.g., mixing, pyrolysis, washing) and associated parameters (temperature, atmosphere, duration) [39].
Methodology:
- Literature Compilation: Gather a corpus of experimental papers relevant to the target catalyst family (e.g., Single-Atom Catalysts).
- Action Term Definition: Identify and define a comprehensive list of synthetic steps and essential parameters required to replicate experiments.
- Model Application: Input full-length, unstructured synthesis paragraphs from "Methods" sections into the ACE model.
- Structured Output Generation: The model outputs a structured sequence of synthesis actions with associated parameters.
- Trend Analysis: Use the structured data to perform statistical inference on synthesis trends, commonly used precursors, carriers, and thermal treatment conditions [39].
Descriptor Engineering and Model Training
The Scientist's Toolkit: Essential Research Reagents & Data Solutions
Table 1: Key computational and experimental resources used in ML-driven catalysis research.
| Item Name | Type | Function & Application |
|---|---|---|
| Open Catalyst Project (OCP) Database | Computational Database | Provides a vast dataset of DFT calculations used to train machine-learned force fields (MLFFs) for predicting adsorption energies and other material properties [38]. |
| Materials Project Database | Computational Database | A repository of computed crystal structures and properties of known and predicted materials, used for initial search space definition [38]. |
| Machine-Learned Force Fields (MLFFs) | Computational Model | Enables rapid and accurate calculation of adsorption energies and structural relaxations, bypassing the high cost of DFT [38]. |
| Adsorption Energy Distribution (AED) | Catalytic Descriptor | A novel descriptor that aggregates binding energies across different catalyst facets, binding sites, and adsorbates, capturing the complexity of real nanostructured catalysts [38]. |
| One-Hot Vectors / Molecular Fragments | Experimental Descriptor | Used to encode the presence or absence of specific metals or functional groups in a catalyst recipe, enabling ML models to learn from experimental formulations [37]. |
| ACE (sAC transformEr) Model | Software Tool | A transformer-based language model for converting unstructured synthesis protocols from literature into structured, machine-readable data [39]. |
Protocol: Developing a Novel Descriptor - Adsorption Energy Distributions (AEDs)
Purpose: To create a comprehensive descriptor that captures the catalytic activity of complex, nanostructured materials beyond single-facet approximations.
Rationale: Traditional descriptors like adsorption energy on a single perfect surface facet often fail to represent real industrial catalysts, which are nanoparticles with diverse surface facets and adsorption sites [38]. The AED descriptor fingerprints the entire energetic landscape of a material.
Methodology:
- Facet and Site Sampling: For a given material, generate a wide range of surface facets (e.g., Miller indices from -2 to 2) and identify multiple binding sites on each.
- Adsorbate Placement: Place key reaction intermediates (e.g., *H, *OH, *OCHO for CO₂ reduction) on all identified sites.
- High-Throughput Energy Calculation: Use the MLFF protocol (Section 3.1) to compute the adsorption energy for every adsorbate-site-facet combination.
- Distribution Construction: Aggregate the thousands of calculated adsorption energies into a probability distribution. This distribution is the AED descriptor for the material [38].
- Similarity Analysis: Compare AEDs of different materials using statistical metrics like the Wasserstein distance (Earth Mover's distance). Perform unsupervised learning (e.g., hierarchical clustering) to group materials with similar AED profiles, which may indicate similar catalytic performance [38].
Protocol: Training and Validating Predictive ML Models
Purpose: To build a robust ML model that maps catalytic descriptors to target properties (e.g., activity, selectivity).
Background: The choice of ML algorithm depends on the data size and nature of the problem. Commonly used algorithms in catalysis include Random Forest, Gradient Boosting, and Neural Networks [36] [37].
Methodology:
- Algorithm Selection:
- Random Forest / XGBoost: An ensemble method effective for both classification and regression tasks with smaller datasets; provides good interpretability [36] [37].
- Artificial Neural Networks (ANNs): Suitable for capturing complex, non-linear relationships, especially with large and high-dimensional datasets [37].
- Feature-Target Pairing: Assemble a dataset where the inputs (X) are the engineered descriptors (e.g., AEDs, one-hot encoded recipe features, elemental properties) and the outputs (y) are the target properties (e.g., faradaic efficiency, turnover frequency, adsorption energy).
- Model Training: Split the data into training and test sets (e.g., 80/20). Train the selected algorithm on the training set to learn the mapping from X to y.
- Model Validation:
- Quantitative Metrics: Evaluate the model on the held-out test set using metrics like Mean Absolute Error (MAE) or R² score.
- Descriptor Importance Analysis: For tree-based models, analyze which descriptors were most critical for predictions to gain chemical insights and validate model logic [37].
Data Integration and Practical Application
Quantitative Performance of ML Algorithms in Catalysis
Table 2: Performance metrics and applications of selected machine learning algorithms in catalysis research.
| ML Algorithm | Application Context | Reported Performance | Key Advantage |
|---|---|---|---|
| Random Forest / XGBoost | Predicting product selectivity (e.g., Faradaic Efficiency) from catalyst recipe descriptors [37]. | High accuracy in identifying critical metal/functional group features for selectivity [37]. | High interpretability; provides feature importance rankings [36]. |
| Machine-Learned Force Fields (MLFFs) | Predicting adsorption energies for ~160 alloys in CO₂ to methanol conversion [38]. | MAE of 0.16 eV vs. DFT benchmark; >10⁴ speed-up vs. DFT [38]. | Quantum-mechanical accuracy at a fraction of the computational cost [38]. |
| Transformer Model (ACE) | Extracting synthesis actions from literature protocols [39]. | ~66% information capture (Levenshtein similarity); 50x faster than manual review [39]. | Automates tedious data curation, enabling large-scale analysis. |
| Multiple Linear Regression (MLR) | Predicting activation energies for C–O bond cleavage in Pd-catalyzed allylation [36]. | R² = 0.93 using DFT-calculated descriptors [36]. | Simple, effective baseline model for well-behaved relationships. |
Integrated Workflow for Catalyst Discovery
The following diagram details the specific workflow for a descriptor-based discovery campaign, as demonstrated in the discovery of catalysts for CO₂ to methanol conversion.
Figure 2: The descriptor-based discovery workflow for CO₂ to methanol catalysts, showcasing the path from element selection to candidate identification via AED computation and clustering.
This structured approach, combining high-throughput computational screening with robust machine learning models, has successfully identified novel catalyst candidates such as ZnRh and ZnPt₃ for CO₂ to methanol conversion, demonstrating the power of this integrated framework to accelerate materials discovery [38].
The discovery of high-performance electrochemical catalysts is pivotal for advancing sustainable energy technologies, including fuel cells, water electrolyzers, and metal-air batteries. However, the exploration of composition-property relationships in catalyst materials presents a significant challenge due to the vast, multi-dimensional design space of potential compositions [40]. Traditional trial-and-error experimental methods are slow, expensive, and inefficient for navigating this combinatorial complexity [41]. In response, high-throughput screening (HTS) methodologies have emerged as a powerful alternative, accelerating the discovery and optimization process by orders of magnitude. These approaches leverage combinatorial experimentation, where libraries of material compositions are synthesized and screened in parallel for specific properties, and computational screening, which uses simulations and machine learning to prioritize the most promising candidates for experimental validation [14] [41]. This application note details specific, successful case studies employing these high-throughput methods, providing researchers with validated protocols and frameworks for their own catalyst discovery pipelines.
Case Study 1: Accelerated Discovery via Text Mining and Multi-Objective Optimization
Background and Objective
A significant challenge in electrocatalysis is the opposing property requirements for different reactions. The Oxygen Reduction Reaction (ORR) and Hydrogen Evolution Reaction (HER) demand high electrical conductivity, while the Oxygen Evolution Reaction (OER) benefits from higher dielectric properties to promote oxygen evolution [40]. With a practically infinite search space of possible multi-element compositions, a research team developed a method to leverage the latent knowledge in scientific literature to predict high-performance candidate materials, thereby reducing reliance on costly initial experiments and simulations [40].
High-Throughput Experimental Protocol
This case study primarily demonstrates a computational HTS pipeline. The experimental validation of the predictions would involve synthesizing the identified Pareto-optimal compositions and testing their electrochemical activity.
Protocol: Text Mining and Predictive Modeling for Catalyst Discovery
Step 1: Automated Literature Curation
- Objective: To assemble a comprehensive corpus of scientific text for model training.
- Procedure: Use tools like the
PaperCollectormodule in MatNexus to collect open-access abstracts from databases such as Scopus and ArXiv. The query should focus on relevant domains (e.g., "electrocatalysts," "high-entropy alloys") and include publications up to the current year [40]. - Output: A structured CSV file containing bibliographical metadata and abstracts.
Step 2: Text Processing
- Objective: To clean and prepare the raw text for natural language processing.
- Procedure: Utilize a
TextProcessormodule to perform the following: - Output: A cleaned, tokenized text corpus.
Step 3: Word2Vec Model Training
- Objective: To generate numerical vector representations (embeddings) of materials science terms that capture their contextual relationships.
- Procedure: Train a Word2Vec model on the processed corpus using the following parameters [40]:
- Model Type: Skip-gram
- Vector Dimensions: 200
- Context Window: 5 words
- Training Method: Hierarchical softmax
- Minimum Word Frequency: 1 (to maximize coverage)
- Output: A trained model that can output a 200-dimensional vector for any word in the vocabulary.
Step 4: Similarity Calculation and Pareto Optimization
- Objective: To identify compositions that optimally balance conflicting properties for specific reactions.
- Procedure:
- For each composition in a large candidate dataset, calculate its similarity score (e.g., cosine similarity) to the keyword vectors for 'conductivity' and 'dielectric' using the trained Word2Vec model [40].
- Perform Pareto front analysis to identify non-dominated compositions. For HER and ORR, the objective is to maximize similarity to 'conductivity' and minimize similarity to 'dielectric'. For OER, the objective is reversed [40].
- Output: A shortlist of high-priority candidate compositions predicted to be high-performing for the target reaction.
Step 5: Experimental Validation
- Objective: To synthesize and electrochemically test the predicted top-performing catalysts.
- Procedure: This involves standard catalyst synthesis (e.g., impregnation, sol-gel) and characterization followed by performance evaluation in a standard three-electrode electrochemical cell to measure metrics such as overpotential and Tafel slope for the target reaction (ORR, HER, OER) [42].
The logical workflow for this text-mining-based discovery pipeline is summarized below.
Key Reagents and Computational Tools
Table 1: Research Reagent Solutions for Text Mining Case Study
| Item Name | Function / Description | Application in Protocol |
|---|---|---|
| MatNexus Software | A computational framework containing modules for paper collection, text processing, and vector generation [40]. | Used for PaperCollector, TextProcessor, and VecGenerator modules to execute the automated discovery pipeline. |
| Scientific Corpus | A collection of open-access scientific abstracts from repositories like Scopus and ArXiv [40]. | Serves as the foundational data source for training the Word2Vec model and establishing composition-property relationships. |
| Word2Vec Model | A natural language processing algorithm that generates numerical word embeddings based on contextual similarity [40]. | Converts text-based descriptions of materials and properties into quantitative vectors for similarity calculation. |
| Pareto Optimization | A multi-objective optimization technique that identifies solutions representing the best trade-off between competing objectives [40]. | Filters the vast composition space to a small set of non-dominated candidates optimized for specific electrochemical reactions. |
Results and Discussion
The text-mining approach successfully identified candidate catalyst compositions purely from historical data [40]. The key advantage of this methodology is its ability to generate predictive hypotheses without initial experimental or quantum-mechanical data, thus exploring regions of compositional space where other data sources are scarce. The subsequent experimental validation confirmed that the predicted compositions exhibited high electrochemical activity for their respective reactions (ORR, HER, OER) [40]. This case study establishes a robust, scalable framework for leveraging the vast, untapped knowledge in scientific literature to accelerate the initial stages of material discovery.
Case Study 2: Closed-Loop Discovery with Autonomous Platforms
Background and Objective
While computational screening narrows the candidate pool, the final validation requires real-world experimentation. The integration of artificial intelligence with automated robotics has given rise to autonomous laboratories, which represent the cutting edge of high-throughput experimental research [14] [31]. These platforms close the loop between prediction, synthesis, and testing, enabling the rapid iteration of design-make-test-analyze cycles that are beyond human capabilities for exploring high-dimensional spaces [31].
High-Throughput Experimental Protocol
Protocol: Autonomous Optimization of an Electrocatalyst
Step 1: Initialization
- Define the experimental design space, including compositional ranges (e.g., ratios of 3-5 metals in a high-entropy alloy) and synthesis parameters (e.g., temperature, precursor concentration) [31].
- Select an initial set of conditions, either randomly or based on prior knowledge.
Step 2: High-Throughput Synthesis and Screening
- An automated robotic platform formulates and synthesizes the catalyst library based on the input parameters [31].
- The synthesized materials are robotically transferred to a high-throughput screening system, which conducts parallel electrochemical measurements (e.g., for oxygen evolution, hydrogen evolution, or CO2 reduction activity) [31].
Step 3: Active Learning and Bayesian Optimization
- The performance data from the screening is fed to an AI model, typically using Bayesian optimization with Gaussian processes [31].
- The model analyzes the results and, balancing exploration and exploitation, proposes the next set of most promising compositions/conditions to test in order to maximize the objective function (e.g., catalytic activity or stability) [31].
Step 4: Iteration and Convergence
- The platform automatically repeats the synthesis and testing cycle based on the AI's recommendations.
- The process continues until performance converges to an optimum or a pre-defined performance threshold is met, significantly accelerating the optimization process [31].
The continuous, automated workflow of an autonomous discovery platform is illustrated in the following diagram.
Key Reagents and Platform Components
Table 2: Research Reagent Solutions for Autonomous Platform Case Study
| Item Name | Function / Description | Application in Protocol |
|---|---|---|
| Automated Robotic Platform | A integrated system of robots for liquid handling, synthesis, and sample transfer [31]. | Executes the physical "make" and "test" steps of the cycle without human intervention, ensuring speed and reproducibility. |
| Bayesian Optimization AI | An active learning algorithm that models the experimental landscape and intelligently selects the next experiments [31]. | Acts as the "brain" of the operation, guiding the exploration of the parameter space to find the global optimum efficiently. |
| High-Throughput Electrochemical Reactor | A device capable of performing parallel electrochemical measurements on multiple catalyst samples simultaneously [31]. | Rapidly generates performance data (e.g., current density, overpotential) for the synthesized material library. |
| Gas-Tight/Inert Atmosphere Modules | Specialized reactor accessories that maintain controlled environments for sensitive reactions like CO2 reduction [31]. | Ensures experimental validity for reactions that require the exclusion of moisture or oxygen. |
Results and Discussion
The implementation of autonomous platforms has led to the accelerated discovery of novel high-performance materials and the optimization of synthesis processes that were previously inaccessible through conventional methods [31]. These systems can efficiently explore complex, multi-variable design spaces for various electrochemical applications, including oxygen evolution, hydrogen evolution, CO2 reduction, and battery electrolyte optimization [31]. By closing the discovery loop, these platforms not only speed up research but also systematically extract fundamental chemistry-structure-property relationships, providing deeper insights that fuel further innovation [31].
The case studies presented herein demonstrate the transformative power of high-throughput methodologies in electrochemical catalyst discovery. The transition from slow, sequential experimentation to parallelized, AI-guided approaches is dramatically compressing the development timeline. Future progress will be fueled by the expansion of shared, high-quality data repositories like PubChem, which are crucial for training robust machine learning models [43] [44], and the global adoption of autonomous labs. As these technologies mature and become more accessible, they promise to unlock a new era of accelerated innovation, delivering the advanced materials necessary for a sustainable energy future.
This application note details a integrated, multi-stage protocol that couples high-throughput computational screening with physics-based modeling to accelerate the discovery and optimization of novel catalytic materials. Designed for catalyst discovery research, this workflow leverages machine learning (ML) across different scales and data modalities—from initial electronic structure descriptor matching to refined mesh-based physical simulation—to efficiently identify promising candidate materials and predict their performance under realistic conditions. The document provides a detailed methodological framework, complete with visualization, essential computational reagents, and quantitative data summaries to facilitate adoption by researchers and scientists.
The traditional pipeline for catalyst development often relies on sequential, resource-intensive experimentation. High-throughput computational screening using first-principles calculations has emerged as a powerful tool to prioritize candidate materials, thereby reducing the experimental search space [4]. However, accurately predicting catalytic performance under operational conditions requires modeling that transcends simple descriptor-based screening and incorporates complex physical phenomena.
This is where a multi-stage ML approach proves critical. The initial stage utilizes fast, data-driven screening of large material libraries based on key descriptors. Promising candidates identified in this stage are then funneled into a more rigorous, physics-based modeling stage that captures mesoscale interactions and long-range dependencies difficult to model with conventional approaches. This hybrid strategy balances computational efficiency with predictive accuracy, enabling a more comprehensive and reliable discovery process.
Application Notes & Protocols
Stage 1: High-Throughput Data-Driven Screening Protocol
This initial stage focuses on the rapid computational identification of candidate materials that are electronically similar to a known high-performance catalyst, such as Palladium (Pd), for hydrogen peroxide (H₂O₂) synthesis [4].
Detailed Methodology
Define Reference System and Primary Descriptor:
- Reference: Select a prototypical catalyst with desired properties (e.g., Pd for H₂O₂ synthesis).
- Descriptor: Use the full electronic Density of States (DOS) pattern as the primary screening descriptor. The DOS includes comprehensive information from both d-bands and sp-bands, the latter of which can be critical for interactions with molecules like O₂ [4].
Construct Initial Candidate Library:
- Consider a pool of base elements (e.g., 30 transition metals).
- Generate a library of potential bimetallic alloy combinations (e.g., 435 binary systems).
- For each combination, model multiple ordered crystal phases (e.g., 10 phases per system, leading to 4350 initial structures) [4].
Perform Thermodynamic Stability Screening:
- Use Density Functional Theory (DFT) calculations to compute the formation energy (∆Ef) for every structure.
- Apply a stability filter. Retain only alloys with ∆Ef < 0.1 eV/atom, indicating they are thermodynamically favorable or can be synthesized as metastable phases [4].
Calculate Electronic Structure and Compute Similarity:
- For all thermodynamically stable alloys, calculate the projected DOS onto the atoms of the most stable, close-packed surface (e.g., (111) facet for fcc metals).
- Quantify the similarity between each candidate's DOS and the reference catalyst's DOS using a defined metric. A sample metric is:
ΔDOS = { ∫ [DOS_candidate(E) - DOS_reference(E)]² · g(E;σ) dE }^{1/2}whereg(E;σ)is a Gaussian weighting function centered at the Fermi energy (EF) to emphasize the most relevant electronic states [4].
Select Candidates for Downstream Analysis:
- Rank all stable candidates by their ΔDOS value (lower value indicates higher similarity).
- Select the top candidates (e.g., those with ΔDOS < 2.0) for experimental validation or further multi-scale modeling [4].
The table below summarizes key quantitative results from a representative high-throughput screening study for Pd-like bimetallic catalysts [4].
Table 1: Summary of High-Throughput Screening Results for Bimetallic Catalysts
| Screening Step | Metric | Value | Description / Outcome |
|---|---|---|---|
| Initial Library | Number of Binary Systems | 435 | Combinations of 30 transition metals |
| Crystal Structures per System | 10 | B1, B2, L1₀, etc. | |
| Total Structures Screened | 4,350 | 435 systems × 10 structures | |
| Stability Filter | Formation Energy Cut-off | < 0.1 eV/atom | Thermodynamic stability criterion |
| Stable Alloys Identified | 249 | Passed the ∆Ef filter | |
| DOS Similarity | Top Candidates Proposed | 8 | Alloys with ΔDOS < ~2.0 |
| Experimental Validation | Successfully Validated Catalysts | 4 | Exhibited performance comparable to Pd |
| Highest Performing Discovery | Ni₆₁Pt₃₉ | Pd-free catalyst, 9.5x cost-normalized productivity vs. Pd |
Stage 2: Physics-Based Modeling with Multi-Stage Graph Neural Networks
For a deeper understanding of catalyst behavior in a reaction environment (e.g., heat and mass transfer in a reactor), candidates from Stage 1 can be analyzed using physics-informed ML models. This protocol uses a Multi-Stage Graph Neural Network (GNN) to predict complex physical fields like temperature and flow in a catalytic system [45].
Detailed Methodology
Problem Formulation & Data Generation:
- Physics Context: Model a physical process relevant to catalysis, such as natural convection (buoyancy-driven flow) within a reactor cavity, which influences reactant distribution and heat management [45].
- High-Fidelity Data: Generate a comprehensive dataset using Computational Fluid Dynamics (CFD) simulations. This dataset should capture the time-dependent evolution of fields like temperature and velocity under varying conditions (e.g., different geometry aspect ratios) [45].
Mesh Graph Construction:
- Represent the computational mesh from CFD as a graph, ( \mathcal{G} = (\mathcal{V}, \mathcal{E}) ).
- Nodes (( \mathcal{V} )): Represent spatial points (mesh cells/vertices). Each node has a feature vector (e.g., current temperature ( \taui^t ), spatial coordinates ( \elli )) [45].
- Edges (( \mathcal{E} )): Represent connections between nearby spatial points, encoding the mesh topology and enabling message passing.
Multi-Stage GNN Architecture:
- Objective: Overcome the limitation of standard GNNs in capturing long-range spatial dependencies by processing the graph at multiple resolutions [45].
- GNN Block: The core building block that performs message passing, updating node features by aggregating information from their local neighbors [45].
- Pooling & Unpooling: Implement learned operators to progressively downsample (pool) the graph to coarser resolutions and then upsample (unpool) back to the original resolution.
- Pooling: Reduces graph complexity and captures broader, global context.
- Unpooling: Restores spatial resolution while incorporating the global context [45].
- Feature Fusion: Combine features from different resolution branches to create a rich, multi-scale representation.
- Refinement Block: A final GNN block that operates on the high-resolution graph, using the fused multi-scale features to make an accurate prediction of the physical field at the next time step (( \tau_i^{t+1} )) [45].
Model Training & Prediction:
- Train the model to minimize the difference between its predictions and the ground-truth CFD data.
- Use the trained model for fast, data-driven forecasting of system evolution, significantly reducing the computational cost compared to running full CFD simulations.
Workflow Visualization
The following diagram illustrates the logical flow and architecture of the multi-stage ML application, from initial screening to detailed physics-based modeling.
The Scientist's Toolkit: Research Reagent Solutions
This section details the essential computational tools and data "reagents" required to implement the described multi-stage protocol.
Table 2: Essential Research Reagents for Multi-Stage ML in Catalyst Discovery
| Item / Resource | Type | Primary Function in Protocol |
|---|---|---|
| Density Functional Theory (DFT) | Computational Method | Calculates fundamental electronic properties (formation energy, DOS) for initial candidate screening [4]. |
| Electronic Density of States (DOS) | Data Descriptor | Serves as a key proxy for catalytic properties; used to find materials electronically similar to a high-performance reference [4]. |
| High-Performance Computing (HPC) Cluster | Infrastructure | Provides the computational power required for high-throughput DFT calculations and training large GNN models. |
| CFD Simulation Dataset | Training Data | Generates high-fidelity, time-series data of physical fields (temperature, velocity) used to train the physics-based GNN model [45]. |
| Graph Neural Network (GNN) Framework | Software Library | Provides the building blocks (message passing, pooling layers) for constructing the multi-stage GNN architecture [45]. |
| Pooling & Unpooling Operators | Algorithm | Enable the GNN to efficiently model systems at multiple spatial scales, capturing both local interactions and global context [45]. |
Addressing HTS Challenges: Data Quality, Hit Identification, and Assay Optimization
High-throughput screening (HTS) has become an indispensable technology for drug discovery and catalyst development, enabling the rapid testing of thousands to hundreds of thousands of compounds [46]. However, the valuable data generated by these sophisticated platforms are susceptible to numerous technical and biological artifacts that can compromise data quality, leading to both false positives and false negatives [47] [48]. In the context of catalyst discovery, where the goal is to identify novel catalytic materials with enhanced performance, these artifacts can obscure true structure-activity relationships and derail development pipelines. Systematic errors, rather than random noise, pose the most significant threat, as they can produce measurements that are consistently over- or underestimated across plates or entire assays [48]. This Application Note details the common sources of variation in screening data, provides methodologies for their detection and mitigation, and frames these protocols within a workflow for catalyst discovery research.
Artifacts in screening data can be broadly categorized as either technical (arising from the experimental platform and procedures) or biological (stemming from the living systems or biochemical reagents used). The table below summarizes the primary artifact sources, their manifestations, and their potential impact on screening outcomes.
Table 1: Common Technical and Biological Artifacts in Screening Data
| Category | Source of Variation | Manifestation in Data | Impact on Screening |
|---|---|---|---|
| Technical | Liquid handling inconsistencies [48] | Row, column, or edge effects on microplates [48] [49] | False positives/negatives clustered in specific locations |
| Instrument drift or reader effects [48] | Time-dependent signal drift across plates | Altered hit selection thresholds | |
| Evaporation [49] | Strong edge effects, particularly in outer wells | Inaccurate measurement of activity in perimeter wells | |
| Autofluorescence & Fluorescence Quenching [47] | Abnormally high or low fluorescence intensity outliers | Masks true bioactivity; produces artifactual readouts | |
| Biological | Compound-mediated cytotoxicity [47] | Substantial reduction in cell count or confluence | Phenotype driven by cell death, not target modulation |
| Cell seeding density variability [47] [50] | Well-to-well differences in signal due to cell number | Poor assay robustness and reduced Z-factors [47] | |
| Phenotypic drift in cell lines [50] | Batch-to-batch variability in assay response | Poor reproducibility between screens | |
| Colloidal compound aggregation [47] | Non-specific inhibition of target activity | False positives that do not confirm in follow-up |
Technical Artifacts
Technical artifacts are introduced by the equipment, reagents, and physical processes of the screening platform. A major concern is systematic spatial bias on microplates, manifesting as row, column, or edge effects, often caused by pipetting inaccuracies, evaporation, or uneven heating [48] [49]. Another significant interference, especially in high-content screening (HCS), is compound autofluorescence or fluorescence quenching, where the test compound's optical properties interfere with the detection technology independent of any true biological effect [47]. This is particularly relevant for catalyst discovery when screening photoluminescent materials or compounds.
Biological Artifacts
Biological artifacts arise from the living cells or biochemical systems under investigation. A primary source is cellular injury or cytotoxicity caused by test compounds, which can lead to dramatic changes in cell morphology, loss of adhesion, or cell death [47]. These effects can obscure the intended readout and be misinterpreted as a positive hit. Furthermore, a lack of consistency in cell culture practices—such as passage number, seeding density, and phenotypic drift—can introduce significant variability, undermining assay reproducibility [50]. In biochemical assays, undesirable compound mechanisms like chemical reactivity or colloidal aggregation can produce false-positive signals [47].
Detection and Analysis Methodologies
Robust detection of artifacts is a critical first step before applying corrective data transformations. The following protocols outline statistical and visualization methods to identify systematic error.
Protocol: Assessing Systematic Error with Hit Distribution Maps
Purpose: To visually identify spatial patterns of systematic error (row, column, or edge effects) across an HTS assay. Principle: In an ideal, error-free screen, confirmed hits are expected to be randomly distributed across the well locations of all screened plates. A non-random hit distribution suggests location-based systematic error [48].
Procedure:
- Hit Selection: Apply a predefined activity threshold (e.g., μ - 3σ, where μ is the mean and σ is the standard deviation of all compound measurements) to select active compounds (hits) from the raw or normalized data [48].
- Generate Hit Count Map: For each well location (e.g., A01, A02, ... P24 for a 384-well plate), sum the total number of hits occurring in that location across all screened plates.
- Visualization: Plot the hit counts per well location as a heat map over a plate template.
- Interpretation: A uniform color across the heat map indicates no spatial bias. Streaks of color along specific rows or columns, or intense color on the edges, confirm the presence of systematic error [48].
Protocol: Statistical Testing for Systematic Error
Purpose: To quantitatively confirm the presence of systematic error prior to applying normalization methods, preventing the introduction of bias into error-free data [48]. Principle: Statistical tests can determine if the observed hit distribution deviates significantly from the expected random distribution.
Procedure:
- Data Preparation: Use the hit count data generated in the previous protocol.
- Apply Discrete Fourier Transform (DFT): Pre-process the hit distribution surface with DFT to account for periodic patterns [48].
- Perform Statistical Test: Apply a Student's t-test to the DFT-transformed data to compare the distribution of hits in putative error-prone regions (e.g., plate edges) versus the rest of the plate.
- Decision: A p-value < 0.05 indicates a statistically significant presence of systematic error, justifying the use of normalization/correction methods [48].
The following workflow integrates these detection protocols into a comprehensive data analysis pipeline.
Protocol: Analysis of Variance (ANOVA) for Variability Assessment
Purpose: To quantify the contribution of different experimental factors (e.g., plate, laboratory, dosing range) to the total variation observed in a screen [51]. Principle: Flexible linear models and ANOVA can partition the variance in the response metric (e.g., cell viability, catalytic output) into components attributable to specific factors built into the experimental design.
Procedure:
- Model Specification: Construct a linear model. For a multi-laboratory screen, this could be:
Response ~ Laboratory + Plate + Drug + Dose + (Drug:Dose) + ε. - Model Fitting: Fit the model to the experimental data (e.g., cell viability values for all cell lines, drugs, and doses).
- ANOVA Execution: Perform ANOVA on the fitted model to obtain the sum of squares and mean squares for each factor.
- Variance Component Estimation: Calculate the proportion of total variance explained by each factor (e.g., plate effects, laboratory). This contextualizes claims of inconsistency and reveals the overall quality of the HTS study [51].
Table 2: Key Statistical Methods for Artifact Detection
| Method | Primary Use | Key Advantage | Implementation Consideration |
|---|---|---|---|
| Hit Distribution Map [48] | Visual identification of spatial bias | Intuitive visualization of row, column, and edge effects | Requires a sufficient number of total hits to be interpretable |
| t-test with DFT [48] | Quantitative confirmation of systematic error | Provides a statistical basis for applying normalization | Should be applied prior to normalization to avoid bias |
| ANOVA-based Linear Models [51] | Quantifying sources of variation | Parses variability from multiple factors (plate, lab, drug) | Requires careful model design incorporating all relevant factors |
| Z'-factor [49] | Quality control per plate | Uses controls to assess assay robustness | Requires positive and negative controls on each plate |
Mitigation and Normalization Strategies
Once artifacts are detected, specific normalization and experimental design strategies can be employed to mitigate their impact.
Data Normalization Techniques
Normalization adjusts raw data to remove systematic bias, making data points comparable across plates and assays. The choice of method depends on the assay design and hit rate.
Table 3: Comparison of HTS Normalization Methods
| Method | Formula | Best For | Limitations |
|---|---|---|---|
| Z-score [48] | ( \hat{x}{ij} = \frac{x{ij} - \mu}{\sigma} ) | Plates with low hit rates and no controls | Assumes most compounds are inactive; sensitive to high hit rates. |
| Control Normalization [48] | ( \hat{x}{ij} = \frac{x{ij} - \mu{neg}}{\mu{pos} - \mu_{neg}} ) | Assays with reliable positive and negative controls | Dependent on control quality and placement. |
| B-score [48] [49] | ( B\text{-}score = \frac{rijp}{MAD_p} ) | Low hit-rate screens with strong spatial bias | Uses median polish; performance degrades with hit rates >20% [49]. |
| Loess Fit [49] | Non-parametric local regression | High hit-rate screens (>20%); robust to edge effects | Computationally intensive; requires scattered controls for best results. |
Critical Application Note: For catalyst discovery and drug sensitivity testing where hit rates can be high (e.g., >20%), the B-score normalization is not recommended as it can incorrectly normalize the data and degrade quality [49]. In these scenarios, a combination of a scattered control layout and Loess-fit normalization is the optimal strategy to reduce row, column, and edge effects without introducing bias [49].
Experimental Design for Artifact Minimization
Proactive experimental design is the most effective way to minimize artifacts.
- Use of Scattered Controls: Disperse positive and negative controls across the entire plate, rather than only in the edge columns, to accurately capture and correct for spatial biases like evaporation [49].
- Standardized Cell Culture Practices: Treat cells as reagents by using standardized subculture procedures and cryopreserved cell stocks to set up experiments. This minimizes variability caused by phenotypic drift and passage number [50].
- Counter-Screens and Orthogonal Assays: Implement follow-up assays that use a fundamentally different detection technology (e.g., orthogonal assay) to confirm that compound activity is not due to a specific artifact like autofluorescence or cytotoxicity [47].
- Adaptive Image Acquisition: For high-content imaging assays, acquire multiple fields of view until a preset threshold number of cells is met to mitigate the impact of compound-mediated cell loss [47].
The Scientist's Toolkit: Research Reagent Solutions
Table 4: Essential Reagents and Materials for Robust HTS
| Item | Function | Application Note |
|---|---|---|
| Cryopreserved Cells [50] | Provides a consistent, standardized source of cells for each screen. | Reduces batch-to-batch variability; essential for reproducible cell-based assays. |
| Validated Control Compounds [48] [52] | Serves as a reference point for data normalization and quality control. | Enables conversion of raw signals to biologically relevant units (e.g., effective concentration [52]). |
| Low-Autofluorescence Media/Plates [47] | Minimizes background signal in fluorescence-based assays. | Critical for high-content screening to avoid signal-to-noise issues. |
| Cell Line Authentication Service [50] | Confirms the genetic identity of cell lines. | Required for peer acceptance of data; prevents use of misidentified lines. |
| Viability Staining Kits [50] | Multiplex measurement of viable or dead cell number in each well. | Used for normalizing data and detecting confounding cytotoxicity. |
Application in Catalyst Discovery Research
The principles of artifact management, developed primarily in pharmaceutical HTS, are directly transferable and critically important to high-throughput catalyst discovery. The integration of computational and experimental methods is accelerating this field [14]. Machine learning (ML) models for catalyst screening are highly dependent on the quality of the training data [27]. Artifacts and systematic errors in experimental data can poison these models, leading to inaccurate predictions and failed catalyst designs. Therefore, the rigorous application of the protocols described herein—for detecting and mitigating variation—is a prerequisite for generating the high-fidelity datasets needed to train reliable ML models [27].
The workflow below illustrates how these protocols are integrated into a closed-loop, high-throughput catalyst discovery pipeline.
Furthermore, in electrochemical catalyst discovery, high-throughput methods are predominantly used for screening catalytic materials, with a noted shortage of similar approaches for other crucial components like ionomers and electrolytes [14]. As this field expands, applying the same rigorous standards for data quality and artifact control across all material classes will be essential for developing cost-competitive and performative catalytic systems.
Hit identification is a critical first step in high-throughput screening (HTS) and virtual screening (VS) campaigns, serving as the gateway from library screening to lead optimization. The process involves establishing clear, defensible criteria to distinguish promising "hit" compounds from inactive substances in a screening library. In both drug discovery and catalyst research, these criteria must balance biological (or catalytic) activity with compound quality to ensure identified hits provide suitable starting points for further optimization. A critical analysis of virtual screening results published between 2007 and 2011 revealed that only approximately 30% of studies reported a clear, predefined hit cutoff, highlighting a significant area for methodological improvement in the field [53]. The establishment of robust hit identification criteria is particularly crucial for academic laboratories and industrial research settings where virtual screening techniques are increasingly employed in parallel with or in place of traditional high-throughput screening methods [53].
The fundamental challenge in hit identification lies in setting thresholds that are sufficiently stringent to identify genuinely promising compounds while being permissive enough to capture chemically novel scaffolds with optimization potential. This balance is especially important when screening against novel targets without a priori known activators or inhibitors, where researchers may intentionally use lower activity cutoffs to improve the structural diversity of identified hit compounds [53]. As screening technologies have advanced, traditional single-concentration HTS approaches have increasingly been supplemented or replaced by quantitative HTS (qHTS) paradigms that generate full concentration-response curves for every compound screened, significantly enhancing the reliability of hit identification and reducing false positives and false negatives [54].
Defining Activity Cutoffs
Current Practices and Recommendations
Activity cutoffs form the foundation of hit identification, providing the primary threshold for compound selection. Based on an analysis of over 400 virtual screening studies, the majority of successful screens employ activity cutoffs in the low to mid-micromolar range (1-100 μM), which provides an optimal balance between identifying genuinely active compounds and maintaining sufficient chemical diversity for subsequent optimization [53]. The distribution of activity cutoffs from published studies shows that 136 studies used 1-25 μM, 54 studies used 25-50 μM, and 51 studies used 50-100 μM as their criteria [53]. While sub-micromolar activity cutoffs are occasionally employed, they are relatively rare in initial virtual screening hits, as the primary goal is typically to identify novel chemical scaffolds with optimization potential rather than fully optimized leads [53].
The selection of appropriate activity cutoffs should be guided by the screening methodology and target characteristics. For single-concentration screening, cutoffs are typically defined as a percentage inhibition (e.g., >50% inhibition at a specified concentration), while for concentration-response assays, potency-based thresholds (IC50, Ki, EC50) are employed [53]. In quantitative HTS (qHTS), where full concentration-response curves are generated for all compounds, more sophisticated curve classification systems can be implemented to categorize hits based on curve quality, efficacy, and completeness [54].
Concentration-Response Curve Classification in qHTS
Quantitative HTS represents a significant advancement in hit identification by testing each compound at multiple concentrations, enabling immediate assessment of concentration-response relationships [54]. The following table outlines a standardized curve classification system for organizing and prioritizing screening results:
Table 1: Concentration-Response Curve Classification System for qHTS Hit Identification
| Curve Class | Description | Efficacy | R² Value | Asymptotes | Hit Priority |
|---|---|---|---|---|---|
| Class 1a | Complete curve, full efficacy | >80% | ≥0.9 | Upper and lower | High |
| Class 1b | Complete curve, partial efficacy | 30-80% | ≥0.9 | Upper and lower | Medium-High |
| Class 2a | Incomplete curve, full efficacy | >80% | ≥0.9 | One asymptote | Medium |
| Class 2b | Incomplete curve, partial efficacy | <80% | <0.9 | One asymptote | Low |
| Class 3 | Activity only at highest concentration | >30% | N/A | None | Very Low |
| Class 4 | Inactive | <30% | N/A | None | Inactive |
This classification system enables researchers to prioritize compounds based on both the quality and completeness of their concentration-response relationships, with Class 1 curves representing the highest confidence hits suitable for immediate follow-up [54]. The system also facilitates the identification of partial agonists/activators or weak inhibitors that may represent valuable starting points for medicinal or catalytic chemistry optimization, particularly for challenging targets.
Ligand Efficiency Metrics
Theoretical Foundation and Calculation
Ligand efficiency (LE) metrics provide a crucial framework for normalizing biological activity to molecular size, addressing the tendency of larger molecules to exhibit higher potency simply through increased surface area for non-specific interactions [53]. The most fundamental ligand efficiency metric is calculated as follows:
Ligand Efficiency (LE) = ΔG / Heavy Atom Count ≈ (1.37 × pKi) / Heavy Atom Count
Where ΔG represents the binding free energy, and heavy atom count includes all non-hydrogen atoms. This normalization is particularly important in fragment-based screening and early hit identification, where smaller compounds with modest but efficient binding are preferred over larger molecules with potentially problematic physicochemical properties [53].
Despite their demonstrated utility in fragment-based screening approaches, ligand efficiency metrics were notably absent as hit selection criteria in the comprehensive analysis of virtual screening studies published between 2007-2011 [53]. This represents a significant opportunity for methodological improvement, as size-targeted ligand efficiency values provide a more balanced assessment of compound quality compared to potency-based criteria alone.
Advanced Efficiency Metrics
Beyond the fundamental ligand efficiency calculation, several specialized efficiency metrics have been developed to address specific aspects of molecular optimization:
Table 2: Ligand Efficiency Metrics for Hit Qualification
| Metric | Calculation | Application | Target Value |
|---|---|---|---|
| Ligand Efficiency (LE) | 1.37 × pKi / Heavy Atom Count | Size-normalized potency | ≥0.3 kcal/mol/HA |
| Lipophilic Efficiency (LipE) | pKi - logP | Efficiency of lipophilic interactions | ≥5 |
| Fit Quality (FQ) | LE molecule / LE reference | Comparison to benchmark | ≥0.8 |
| Binding Efficiency Index (BEI) | pKi / MW (kDa) | Molecular weight normalization | N/A |
| Surface Efficiency Index (SEI) | pKi / PSA | Polar surface area normalization | N/A |
These metrics collectively provide a multidimensional assessment of compound quality, helping to identify hits with balanced properties that are more likely to progress successfully through optimization campaigns. In particular, Lipophilic Efficiency (LipE) has emerged as a valuable metric for identifying compounds that achieve potency through efficient, specific interactions rather than excessive hydrophobicity, which often correlates with poor solubility and promiscuous binding [53].
Experimental Protocols for Hit Identification
Protocol 1: Implementation of qHTS for Concentration-Response Screening
Principle: Quantitative High-Throughput Screening (qHTS) involves testing each compound at multiple concentrations in a single screening campaign, generating complete concentration-response curves for all library members [54]. This approach significantly reduces false positive and false negative rates compared to traditional single-concentration screening.
Materials and Reagents:
- Compound library formatted as concentration series (typically 7+ concentrations)
- Assay reagents optimized for miniaturized format (e.g., 1,536-well plates)
- Positive and negative control compounds
- Robotic liquid handling systems capable of nanoliter dispensing
- High-sensitivity detection system appropriate for assay technology (luminescence, fluorescence, absorbance)
Procedure:
- Library Preparation: Prepare compound library as a titration series using 5-fold dilutions, generating a concentration range spanning at least four orders of magnitude [54].
- Assay Optimization: Optimize assay conditions for miniaturized format, ensuring robust Z' factor (≥0.5) and signal-to-background ratio.
- Screen Implementation: Transfer compound titrations to assay plates using pintool or acoustic dispensing technologies.
- Data Acquisition: Measure assay response using appropriate detection modality.
- Curve Fitting: Fit concentration-response data to four-parameter logistic Hill equation [10]: Ri = E₀ + (E∞ - E₀) / (1 + exp{-h[logCi - logAC₅₀]}) Where Ri is response at concentration Ci, E₀ is baseline, E∞ is maximum response, h is Hill slope, and AC₅₀ is half-maximal activity concentration.
- Curve Classification: Categorize curves according to Table 1 classification system.
- Hit Selection: Prioritize compounds based on curve class, potency, and efficacy.
Troubleshooting Notes:
- For compounds showing activity only at the highest concentration (Class 3 curves), consider retesting with extended concentration range to confirm activity.
- Poor curve fits (low R² values) may indicate assay interference or compound aggregation - investigate using orthogonal assays.
- Ensure consistent sample preparation across library, as variations in compound solubility or stability can significantly impact concentration-response curves [54].
Protocol 2: Hit Triage and Confirmation Workflow
Principle: Following primary screening, putative hits must undergo rigorous triage to eliminate artifacts and confirm specific activity against the target.
Materials and Reagents:
- Hit compounds from primary screen
- Orthogonal assay technology for confirmation
- Counterscreen reagents to assess assay interference
- Solubility assessment tools (DLS, nephelometry)
- Chemical reagents for purity confirmation (HPLC, MS)
Procedure:
- Compound QC: Confirm hit identity and purity using analytical methods (LC-MS, NMR).
- Concentration-Response Confirmation: Retest hits in concentration-response format using fresh powder or reformatted samples.
- Orthogonal Assay: Confirm activity using biochemically distinct assay format.
- Counterscreening: Test for common interference mechanisms (aggregation, fluorescence, reactivity).
- Selectivity Assessment: Evaluate activity against related targets or antitargets.
- Ligand Efficiency Calculation: Determine size-normalized efficiency metrics.
- Promiscuity Assessment: Screen against nuisance targets or analyze historical screening data.
Critical Analysis Parameters:
- Confirm potency within 3-fold of original measurement
- Eliminate compounds with significant interference in counterscreens
- Prioritize compounds with ligand efficiency ≥0.3 kcal/mol/heavy atom
- Apply drug-like filters (Lipinski, Veber) appropriate for project goals
Workflow Visualization
Diagram 1: Comprehensive Hit Identification Workflow. This diagram illustrates the integrated process of applying both activity cutoffs and ligand efficiency metrics in hit identification.
The Scientist's Toolkit: Essential Research Reagents and Materials
Table 3: Essential Research Reagents and Materials for Hit Identification
| Category | Specific Items | Function in Hit ID | Considerations |
|---|---|---|---|
| Compound Management | DMSO, plate seals, 1,536-well plates | Compound storage and formatting | Maintain compound integrity, minimize evaporation |
| Assay Reagents | Substrates, cofactors, enzymes, cell lines | Target-specific activity detection | Optimize for sensitivity and miniaturization |
| Detection Systems | Luminescence, fluorescence, absorbance reagents | Signal generation and measurement | Match to assay technology and detection platform |
| Control Compounds | Known activators, inhibitors, tool compounds | Assay performance monitoring | Include on every plate for quality control |
| Liquid Handling | Pintools, acoustic dispensers, robotic arms | Precise compound transfer | Ensure accuracy in nanoliter volumes |
| Data Analysis | Curve-fitting software, statistical packages | Concentration-response analysis | Implement robust fitting algorithms |
The establishment of rigorous, multidimensional hit identification criteria represents a critical foundation for successful screening campaigns in both drug discovery and catalyst research. By implementing standardized activity cutoffs typically in the 1-100 μM range complemented by size-targeted ligand efficiency metrics (LE ≥ 0.3 kcal/mol/heavy atom), researchers can significantly enhance the quality of their hit selection process [53]. The adoption of quantitative HTS methodologies that generate complete concentration-response curves for all screened compounds further strengthens this process by providing immediate structure-activity relationships and reducing false positive rates [54].
The integration of these complementary approaches—potency-based activity cutoffs, ligand efficiency normalization, and quantitative concentration-response analysis—creates a robust framework for identifying high-quality starting points for optimization campaigns. This multidimensional assessment is particularly valuable for identifying chemically novel scaffolds with balanced properties, ultimately enhancing the efficiency of the transition from hit identification to lead optimization in both pharmaceutical and catalyst discovery research.
In high-throughput screening (HTS) for catalyst discovery, the reliability of biological or chemical activity data is paramount. Effective data preprocessing, encompassing robust normalization strategies and stringent quality control (QC) measures, is critical for distinguishing true catalytic enhancers from experimental noise. This document outlines standardized protocols for data normalization and QC, specifically framed within the context of HTS campaigns aimed at identifying novel catalysts or signal enhancers in biological systems.
Normalization Strategies
Normalization adjusts raw experimental data to correct for technical variability, enabling accurate comparison of biological effects across different screening plates, batches, and conditions. The choice of strategy depends on the experimental design and data structure.
Table 1: Comparison of Normalization Methods for High-Throughput Screening
| Method | Principle | Formula | Use Case | Advantages | Limitations |
|---|---|---|---|---|---|
| Standard Curve Normalization [52] | Converts raw signals to biologically meaningful units (e.g., concentration) using a reference standard curve. | Derived from standard curve | When a quantifiable biological response standard is available (e.g., a catalyst or inhibitor concentration curve). | Provides absolute, interpretable values; robust to plate-wide effects. | Requires running a standard on every plate; consumes resources. |
| Quantile Normalization [55] | Forces the distribution of signal intensities to be identical across all plates or samples. | Non-parametric; based on rank-ordering and averaging distributions [55]. | Large-scale qPCR or HTS where genes/compounds are randomly distributed across many plates [55]. | Powerful correction for technical variation; does not require control genes. | Assumes overall response distribution is constant; can be invalid for strongly biased libraries. |
| Rank-Invariant Normalization [55] | Identifies and uses a set of genes or compounds whose rank order is stable across conditions for scaling. | ( \text{Scale Factor} \betaj = \frac{\alpha{\text{reference}}}{\alpha_j} ) [55] | Experiments where a subset of features is expected to be unaffected by the experimental conditions [55]. | Data-driven; does not require pre-selected controls. | Performance depends on the size and stability of the invariant set. |
| Z-Score Normalization | Standardizes data based on the mean and standard deviation of a reference population on each plate. | ( Z = \frac{X - \mu}{\sigma} ) | Primary HTS where per-plate median and MAD (Median Absolute Deviation) or standard deviation are used for hit identification. | Simple to compute and interpret; useful for identifying statistical outliers. | Sensitive to the presence of strong hits, which can inflate the standard deviation. |
Protocol: Standard Curve Normalization for Catalyst Screening
This protocol is adapted from HTS methods used to identify interferon signal enhancers, a concept directly transferable to catalyst discovery [52].
1. Purpose: To normalize raw assay readouts (e.g., luminescence, fluorescence) to equivalent catalyst concentration units using a standard dose-response curve.
2. Materials:
- Test compounds (catalyst library)
- Known, potent catalyst for the reaction of interest (for the standard curve)
- Assay reagents (substrates, buffers, detection reagents)
- 384-well or 1536-well microplates
- Liquid handling robotics
- Plate reader (e.g., luminometer, fluorometer)
3. Procedure: Step 1: Plate Design.
- On each screening plate, include a 10-point, 2-fold serial dilution of the standard catalyst, covering a range from full saturation to no effect.
- Distribute the test compounds randomly across the plate to avoid spatial bias.
Step 2: Assay Execution.
- Run the catalytic reaction under standard conditions for all wells, including the standard curve and test compounds.
- Measure the raw output signal (e.g., luminescent intensity).
Step 3: Data Processing.
- Fit the dose-response data from the standard curve wells to a 4-parameter logistic (4PL) model using analysis software (e.g., R, Prism).
- Use the resulting fitted curve to interpolate the raw signal from each test compound well into an "Effective Catalyst Concentration" (ECC).
- The ECC values constitute the normalized dataset for subsequent hit-picking.
Data Quality Control Measures
Quality control ensures that the data generated from an HTS campaign is of sufficient quality to support reliable conclusions. Key characteristics of high-quality data include completeness, consistency, lack of bias, and accuracy [56].
Table 2: Essential Quality Control Checks for HTS Data
| QC Metric | Description | Acceptance Criterion | Investigation/Action | ||
|---|---|---|---|---|---|
| Signal-to-Background (S/B) | Ratio of the positive control signal to the negative control signal. | S/B > 5 (minimum); higher is better. | If low, check reagent activity and assay incubation times. | ||
| Z'-Factor [52] | Statistical parameter assessing the assay's robustness and suitability for HTS. | ( Z' = 1 - \frac{3(\sigma{p} + \sigma{n})}{ | \mu{p} - \mu{n} | } ) | Z' > 0.5 indicates an excellent assay. If low, optimize assay window or reduce variability. |
| Plate Uniformity | Measures the consistency of signals across the plate, often for negative controls. | CV (Coefficient of Variation) of negative controls < 20%. | Check for edge effects, liquid handler malfunctions, or reagent precipitation. | ||
| Hit Reproducibility | Consistency of hit identification across technical replicates or neighboring plates. | >90% correlation between replicate measurements for the same compounds. | Investigate compound stability, pipetting errors, or assay interferences. |
Protocol: Calculation of Z'-Factor for Assay Quality Assurance
1. Purpose: To quantitatively evaluate the quality and robustness of an HTS assay before and during a full-scale screening campaign.
2. Data Requirements:
- A minimum of 16 data points each for a positive control (e.g., reaction with a known potent catalyst) and a negative control (e.g., reaction with no catalyst or an inactive compound).
3. Procedure: Step 1: Calculate Means and Standard Deviations.
- Compute the mean (µₚ) and standard deviation (σₚ) of the positive control signals.
- Compute the mean (µₙ) and standard deviation (σₙ) of the negative control signals.
Step 2: Apply the Z'-Factor Formula.
- Calculate the Z'-Factor using the formula: ( Z' = 1 - \frac{3(\sigma{p} + \sigma{n})}{|\mu{p} - \mu{n}|} )
Step 3: Interpret the Result.
- Z' > 0.5: Excellent assay suitable for HTS.
- 0.5 ≥ Z' > 0: A marginal assay that may be acceptable but could benefit from optimization.
- Z' ≤ 0: Assay is not suitable for HTS due to a small signal window or high variability.
Workflow Visualization
The following diagram illustrates the integrated workflow for data preprocessing in a high-throughput screening campaign.
HTS Data Preprocessing Flow
The Scientist's Toolkit: Research Reagent Solutions
Table 3: Essential Materials for HTS Normalization and QC
| Item | Function in Preprocessing | Example Application |
|---|---|---|
| Standard Catalyst Compound | Serves as the reference for generating the dose-response curve for normalization [52]. | Normalizing raw luminescence to effective concentration in a catalyst screening assay. |
| Control Plates | Plates containing only positive and negative controls; used for inter-plate QC and Z'-Factor calculation. | Monitoring assay performance and stability over the duration of a multi-day screen. |
| Data Analysis Software (R/Python) | Provides the computational environment for implementing quantile, rank-invariant, and Z-score normalization algorithms [55]. | Executing custom data preprocessing scripts and generating quality control dashboards. |
| Liquid Handling Robotics | Ensures precision and reproducibility in dispensing standard curves, controls, and test compounds. | Minimizing volumetric errors that introduce technical variability and bias. |
The integration of machine learning (ML) into high-throughput screening (HTS) frameworks has transformed the paradigm of catalyst discovery, enabling the rapid assessment of vast chemical spaces that would be intractable through empirical methods alone [27] [36]. This data-driven approach promises to accelerate the identification of novel catalytic materials for applications ranging from drug development to sustainable energy solutions [57] [58]. However, the performance and predictive utility of ML models are critically dependent on two foundational pillars: the quality and volume of underlying data and the effectiveness of feature engineering—the process of creating representative descriptors that capture essential catalyst properties [27] [59] [38]. Within high-throughput computational-experimental screening protocols, these limitations directly impact the reliability of candidate selection and the efficiency of the discovery pipeline [4]. This article examines these core challenges through a practical lens, providing data-supported insights and structured protocols to aid researchers in navigating these constraints.
Quantitative Landscape of ML Dependencies in Catalysis Research
The dependence of ML models on data quality and feature design is not merely theoretical but is quantitively demonstrated across catalysis studies. The following tables summarize key performance metrics and their relationship to data and feature parameters.
Table 1: Impact of Data Quality and Volume on ML Model Performance
| Catalytic System | Data Quantity | Data Quality Challenge | Impact on Model Performance | Reference |
|---|---|---|---|---|
| Oxidative Coupling of Methane (OCM) | Small dataset | Limited catalyst diversity & experimental error | MAE* of 2.2-2.3% in C2 yield prediction; model struggled to capture various 0% yield data points [59]. | [59] |
| General qHTS Simulation | 14-point concentration curves | Asymptotes not defined in concentration range | AC50* estimates spanned several orders of magnitude, showing very poor repeatability [10]. | [10] |
| General qHTS Simulation | Increased replicate number (n=1 to n=5) | Random measurement error | Precision of AC50* and Emax estimates noticeably increased with more replicates [10]. | [10] |
| CO2 to Methanol Catalysts | ~160 metallic alloys | Accuracy of pre-trained ML force fields | Mean Absolute Error (MAE) of 0.16 eV for adsorption energies, within acceptable range for screening [38]. | [38] |
MAE: Mean Absolute Error; qHTS: Quantitative High-Throughput Screening; *AC50: Concentration for half-maximal response; *Emax: Maximal response
Table 2: Feature Engineering Approaches and Outcomes in Catalyst Design
| Feature Engineering Method | Catalytic Application | Key Outcome | Reference |
|---|---|---|---|
| Automatic Feature Engineering (AFE) | OCM, Ethanol to Butadiene, Three-Way Catalysis | Achieved low MAE (e.g., 1.69% for C2 yield) without prior knowledge, outperforming raw composition descriptors [59]. | [59] |
| Adsorption Energy Distribution (AED) | CO2 to Methanol Conversion | Novel descriptor capturing energy spectrum across facets/sites; enabled screening of 160 alloys via ML force fields [38]. | [38] |
| Electronic Density of States (DOS) Similarity | H2O2 Direct Synthesis (Pd-replacement) | Identified Ni61Pt39 catalyst with 9.5-fold cost-normalized productivity enhancement over Pd [4]. | [4] |
| d-band center & scaling relations | Various Heterogeneous Catalysis | Useful but constrained to certain surface facets or limited material families (e.g., d-metals) [38]. | [38] |
Experimental Protocols for Addressing ML Limitations
Protocol 1: Automated Feature Engineering for Small Data in Catalyst Discovery
Application Note: This protocol is designed for scenarios with limited catalytic performance data (small data), where traditional descriptor design requires prohibitive prior knowledge. It automates the generation and selection of physically meaningful features, enabling effective modeling where conventional methods fail [59].
Materials and Reagents:
- Primary Dataset: A tabular dataset comprising catalyst compositions (e.g., elemental lists for supported multi-element catalysts) and their corresponding performance metrics (e.g., yield, conversion, T50).
- Feature Library: A comprehensive repository of physicochemical properties for catalyst constituents (e.g., XenonPy library containing 58 features for elements) [59].
- Computational Environment: A standard computing environment capable of running machine learning workflows (e.g., Python with scikit-learn).
Procedure:
- Assign Primary Features: For each catalyst in the dataset, compute a set of primary features by applying commutative operations (e.g., maximum, minimum, weighted average, sum) to the properties in the feature library. This accounts for the elemental composition and notational invariance [59].
- Synthesize Higher-Order Features: Generate a large pool (typically 10³–10⁶) of compound features. These are created by applying arbitrary mathematical functions (e.g., logarithmic, square root) to the primary features and then taking products of two or more of these function outputs. This step addresses nonlinear and combinatorial effects [59].
- Feature Selection and Model Building:
- Use a simple, robust regression algorithm like Huber regression to avoid overfitting.
- Employ a feature selection wrapper method (e.g., sequential feature selection) in conjunction with leave-one-out cross-validation (LOOCV).
- The objective is to identify the feature subset (e.g., 8 features) that minimizes the LOOCV Mean Absolute Error (MAE).
- Model Validation: The final model, built using the selected features, should be evaluated on a hold-out test set or via rigorous cross-validation. The MAE should be compared against the experimental error to assess practical utility [59].
Protocol 2: High-Throughput Screening with Density of States (DOS) Similarity Descriptor
Application Note: This protocol leverages electronic structure similarity as a powerful, physically grounded descriptor for discovering bimetallic catalysts, effectively reducing reliance on massive, pre-existing catalytic performance data [4].
Materials and Reagents:
- Reference Catalyst: A well-known catalyst with desired properties (e.g., Pd for H2O2 synthesis).
- Candidate Element Pool: A list of transition metals for constructing bimetallic alloys.
- First-Principles Code: Software for Density Functional Theory (DFT) calculations (e.g., VASP, Quantum ESPRESSO).
Procedure:
- Define Search Space and Calculate Stability: Select binary combinations from the candidate element pool. For each combination, compute the formation energy (ΔEf) of multiple ordered crystal phases (e.g., B2, L10) using DFT. Filter for thermodynamically stable or metastable alloys (ΔEf < 0.1 eV/atom is a common threshold) [4].
- Compute Electronic Density of States (DOS): For the most stable surface (e.g., close-packed (111) surface) of each candidate alloy and the reference catalyst, calculate the projected electronic Density of States (DOS) using DFT. Ensure the calculation includes both d-states and sp-states [4].
- Quantify DOS Similarity: Calculate the similarity between the candidate's DOS and the reference catalyst's DOS using a defined metric. For example [4]:
ΔDOS = { ∫ [DOS_candidate(E) - DOS_reference(E)]² · g(E;σ) dE }^{1/2}whereg(E;σ)is a Gaussian function centered at the Fermi energy (EF) with a standard deviation σ (e.g., 7 eV), giving higher weight to energies near EF. - Experimental Validation: Synthesize the top candidate materials (those with the lowest ΔDOS values) and experimentally evaluate their catalytic performance (e.g., activity, selectivity) for the target reaction [4].
Workflow Visualization: Integrating Computational and Experimental Screening
The following diagram illustrates a robust high-throughput screening protocol that integrates computational prescreening using ML and physical descriptors with experimental validation, creating a closed-loop system for efficient catalyst discovery.
Figure 1: High-Throughput Catalyst Discovery Workflow. This protocol integrates computational screening based on stability and electronic descriptors with experimental validation, creating a feedback loop to improve ML models.
The Scientist's Toolkit: Key Research Reagent Solutions
Table 3: Essential Computational and Experimental Reagents for ML-Driven Catalyst Screening
| Tool / Reagent | Type | Primary Function in Workflow | Reference / Example |
|---|---|---|---|
| XenonPy Feature Library | Computational Library | Provides a comprehensive set of 58+ primary physicochemical properties of elements for initial feature assignment in AFE. | [59] |
| Open Catalyst Project (OCP) | Pre-trained ML Model | Provides machine-learned force fields (e.g., Equiformer_V2) for rapid, DFT-accurate adsorption energy calculations on thousands of material surfaces. | [38] |
| Materials Project Database | Computational Database | A repository of computed material properties used to identify stable, experimentally observed crystal structures for initial search space definition. | [38] [4] |
| Synthesis-on-Demand Chemical Libraries | Experimental Resource | Vast libraries (e.g., multi-billion compound spaces) from which predicted, novel catalyst compositions can be sourced and synthesized for physical testing. | [58] |
| Density of States (DOS) Similarity | Computational Descriptor | A physically insightful descriptor that bypasses the need for massive reaction data by identifying materials with electronic structures similar to a high-performing reference catalyst. | [4] |
High-throughput screening (HTS) serves as a cornerstone technology in modern catalyst and drug discovery, enabling the rapid evaluation of millions of chemical or biological entities against specific targets to identify promising hit compounds [60]. However, traditional HTS approaches face significant challenges, including lengthy timelines, high costs, and substantial resource demands. The classical Systematic Evolution of Ligands by Exponential Enrichment (SELEX) procedure for aptamer screening, for example, typically requires 9-20 rounds over 2-3 months to complete [61]. Similarly, traditional drug discovery efforts can take 10-15 years with costs exceeding $2.5 billion and success rates below 14% from Phase 1 trials to market [60].
To address these inefficiencies, researchers have developed innovative strategies focusing on two complementary approaches: rational library design and machine learning (ML)-driven iterative screening. This Application Note provides detailed protocols and implementation guidelines for integrating these advanced methodologies into catalyst discovery workflows, enabling researchers to significantly enhance screening efficiency while maintaining or improving hit discovery quality.
Library Design Principles for Screening Optimization
Fundamental Concepts and Strategic Importance
Library design constitutes the foundational pillar of efficient screening campaigns. A well-designed molecular library maximizes chemical diversity and functional coverage while minimizing redundancy and unnecessary screening burden. Rational library design focuses on creating screening collections with optimized molecular properties, structural diversity, and minimized presence of promiscuous or problematic compounds that could lead to false positives [60].
In the context of aptamer screening, incorporating rational library design principles has demonstrated dramatic improvements in process efficiency. By moving beyond relatively blind initial libraries, researchers have significantly reduced aptamer screening cycles to under 8 rounds, with some advanced methods achieving single-round screenings and decreasing overall screening time to under 3 weeks while simultaneously enhancing aptamer performance [61].
Practical Implementation Framework
Key Considerations for Library Design:
- Diversity Optimization: Balance molecular complexity with coverage of chemical space relevant to the target class
- Property-Based Filtering: Implement filters for undesirable molecular characteristics, including Pan-Assay Interference Compounds (PAINS) [60]
- Synthesizability Assessment: Prioritize compounds with feasible synthetic pathways and adequate purity expectations
- Target-Informed Design: Incorporate structural or sequence information about biological targets when available
Table 1: Library Design Optimization Strategies
| Strategy | Key Principles | Expected Outcomes |
|---|---|---|
| Diversity-Oriented Design | Maximizes structural and functional variety; covers broad chemical space | Increased probability of identifying novel hit compounds; reduced bias in screening outcomes |
| Focused Library Design | Targets specific protein families or catalytic mechanisms; uses known structure-activity relationships | Higher initial hit rates for targeted applications; reduced library size requirements |
| Property-Based Filtering | Removes compounds with undesirable characteristics (e.g., PAINS, reactive groups) | Reduced false positive rates; improved compound developability |
| Dynamic Library Design | Utilizes templated synthesis or adaptive assembly based on screening results | Continuous library optimization during screening; identification of synergistic combinations |
Iterative Screening with Machine Learning Integration
Theoretical Foundation and Efficiency Metrics
Iterative screening represents a paradigm shift from conventional HTS by employing a batch-based approach where machine learning models select the most promising compounds for subsequent screening rounds based on accumulated data [62]. This methodology directly addresses the central challenge of HTS: the increasing complexity of assays that makes screening large compound libraries progressively more resource-intensive [63].
Prospective validation in large-scale drug discovery projects demonstrates that ML-assisted iterative screening of just 5.9% of a two-million-compound library recovered 43.3% of all primary actives identified in parallel full HTS [63]. Retrospective analyses further indicate that screening 35% of a library over three iterations yields a median return rate of approximately 70% of active compounds, while increasing to 50% of the library screened achieves approximately 80% return of actives [62].
Implementation Workflow and Protocol
The following diagram illustrates the core iterative screening workflow integrating machine learning:
Protocol 1: ML-Driven Iterative Screening for Catalyst Discovery
Step 1: Initial Data Collection and Model Training
- Collect historical screening data or literature-derived datasets relevant to your target catalyst class [64]
- For SCR NOx catalysts, this includes composition, structure, morphology, preparation method, and reaction condition data (62 feature variables) [64]
- Train initial machine learning model (e.g., Artificial Neural Network with three hidden-layer structure of 6, 4, and 2 neurons) [64]
- Validate model performance using correlation coefficient (R) and root mean square error (RMSE) metrics
Step 2: Candidate Screening and Selection
- Use optimization algorithm (e.g., Genetic Algorithm) to identify candidate catalysts with desired performance thresholds [64]
- Set application-relevant performance thresholds (e.g., >90% conversion efficiency for SCR NOx catalysts across temperature range 100-300°C) [64]
- Select candidates for experimental validation based on frequency analysis of promising element combinations
Step 3: Experimental Synthesis and Characterization
- Synthesize selected catalyst candidates using appropriate methods
- For Fe-Mn-Ni catalysts: Co-precipitation method using carbonate solution with metal nitrates, pH maintenance at 11.5, stirring for 17h, filtration, washing, drying at 30°C overnight, calcination at 500°C for 2h [64]
- Characterize materials using XRD, TEM, and performance testing under relevant conditions
Step 4: Model Updating and Iteration
- Incorporate new experimental results into training dataset
- Retrain ML model with expanded dataset
- Repeat screening and selection process with updated model
- Continue iterations until performance criteria are met or convergence achieved (typically 3-4 iterations) [64]
Advanced Applications and Integrated Workflows
Case Study: Environmental Catalyst Development
The iterative ML approach has been successfully applied to environmental catalyst discovery, specifically for Selective Catalytic Reduction (SCR) of nitrogen oxides (NOx) [64]. After four iterations of the experiment-ML cycle, researchers identified and synthesized a novel Fe-Mn-Ni catalyst with low cost, high activity, and a wide range of application temperatures [64]. This approach demonstrates how iterative screening can rapidly navigate complex multi-element composition spaces that would be prohibitively large for exhaustive experimental exploration.
Table 2: Quantitative Performance Metrics for Screening Optimization
| Method | Screening Rounds | Time Requirement | Hit Recovery Rate | Resource Utilization |
|---|---|---|---|---|
| Traditional SELEX | 9-20 rounds | 2-3 months | Baseline | High compound consumption |
| Optimized Aptamer Screening | <8 rounds (down to single-round) | <3 weeks | Improved performance | Significantly reduced |
| Full HTS | 1 exhaustive screen | Weeks to months | 100% of actives | 100% of library |
| ML-Iterative (3 iterations) | 3 batches | Proportional to batch number | ~70% of actives (35% library) | 35% of library screened |
| ML-Iterative (6 iterations) | 6 batches | Proportional to batch number | ~90% of actives (50% library) | 50% of library screened |
Integrated Experimental and Computational Workflow
For complex catalyst discovery projects, the following integrated workflow combines rational library design with ML-driven iterative screening:
Essential Research Reagents and Materials
Table 3: Research Reagent Solutions for Screening Optimization
| Category | Specific Reagents/Materials | Function in Workflow |
|---|---|---|
| Library Compounds | Diverse chemical libraries (1M+ compounds); Fragment libraries (MW <300); Targeted chemotype collections | Provides foundation for screening; Different library types balance diversity with focus |
| Catalyst Precursors | Metal salts (Fe(NO₃)₃·9H₂O, Mn(NO₃)₂, Ni(NO₃)₂·6H₂O); Ligand precursors; Support materials (zeolites, alumina) | Enables synthesis of predicted catalyst compositions; Varying precursors affect catalyst properties |
| Analysis Reagents | Na₂CO3 for precipitation; pH adjustment solutions (NaOH); Characterization standards | Supports synthesis and purification; Ensures consistent material quality |
| Assay Components | Substrate solutions; Detection reagents (chromogenic, fluorescent); Quenching solutions | Enables high-throughput activity assessment; Different detection methods minimize artifacts |
| ML Infrastructure | ANN frameworks (TensorFlow, PyTorch); Optimization algorithms (Genetic Algorithm); Data processing tools | Powers candidate prediction and prioritization; Accessible on standard desktop computers [62] |
Validation Frameworks and Comparative Analysis of Screening Methodologies
In the context of high-throughput screening (HTS) for catalyst discovery, assay validation provides the critical foundation for generating reliable, reproducible, and scientifically meaningful data. As catalyst research increasingly adopts automated and miniaturized approaches, establishing rigorous validation protocols ensures that screening methods accurately identify promising catalytic materials and accurately quantify structure-performance relationships. According to the Organisation for Economic Co-operation and Development (OECD), validation is formally defined as "the process by which the reliability and relevance of a particular approach, method, process or assessment is established for a defined purpose" [65]. In catalyst discovery, this translates to ensuring that high-throughput assays consistently identify catalytic materials with desired properties under specified experimental conditions.
The fundamental principles of assay validation—reliability and relevance—take on specific importance in catalyst screening. Reliability refers to the reproducibility of the method within and between laboratories over time when performed using the same protocol, while relevance ensures the scientific underpinning of the test and that it measures effects that are meaningful for catalytic performance [65]. For catalytic materials research, this often involves establishing correlation between high-throughput screening results and actual catalytic performance under realistic conditions. The concept of fitness-for-purpose acknowledges that the extent of validation should be appropriate for the specific stage of research, ranging from early discovery screening to definitive performance qualification [66].
Core Principles of Assay Validation
Defining Validation Metrics and Acceptance Criteria
A validation protocol for catalytic materials research must establish quantitative metrics and predetermined acceptance criteria that collectively demonstrate the assay's robustness. These criteria encompass multiple performance dimensions that can be statistically evaluated during validation studies.
Table 1: Key Validation Metrics for Catalytic Materials Screening Assays
| Validation Metric | Definition | Acceptance Criteria | Application in Catalyst Discovery |
|---|---|---|---|
| Z'-Factor | A dimensionless parameter that reflects the assay signal dynamic range and data variation [67] | Z' > 0.4 indicates excellent assay; Z' > 0.5 is ideal for HTS [67] | Assesses separation between high-performance and low-performance catalyst signals |
| Signal Window | The ratio of the signal range between controls to the variability of the signals [67] | Signal window > 2.0 is acceptable for HTS [67] | Determines ability to distinguish catalysts with significantly different activities |
| Coefficient of Variation (CV) | The ratio of the standard deviation to the mean, expressed as a percentage [67] | CV < 20% for all control signals [67] | Measures precision and reproducibility of catalytic activity measurements |
| Signal-to-Noise Ratio | Ratio of the specific assay signal to the background signal | Dependent on detection method; typically >5:1 | Critical for detecting small differences in catalytic performance |
| Day-to-Day Variation | Consistency of results when performed on different days by different operators | < 20% variance in control values | Ensures catalytic activity measurements remain stable over time |
Establishing Fitness-for-Purpose in Catalyst Discovery
The validation approach must align with the specific research objective, ranging from early-stage discovery to definitive performance qualification. The concept of "fit-for-purpose" assay development recognizes that different stages of research require different levels of validation stringency [66].
- Exploratory Research Phase: For initial catalyst screening, fit-for-purpose assays provide rapid, flexible data generation without full validation. These methods are optimized for specific study needs and can be adjusted as research objectives evolve, making them ideal for evaluating novel catalytic materials or reaction systems where established protocols may not exist [66].
- Advanced Development Phase: Fully validated assays are required when moving from catalyst discovery to performance optimization and mechanistic studies. These methods meet strict regulatory guidelines for accuracy, precision, specificity, and reproducibility, and are essential for generating reliable structure-activity relationships (SAR) and comparative performance data [66].
- Integrated Validation Approach: For catalytic materials research, a tiered validation strategy often proves most efficient, beginning with fit-for-purpose methods for initial screening and progressing to fully validated assays for lead catalyst optimization and mechanistic studies [65] [66].
Experimental Protocol for Assay Validation
Comprehensive Workflow for Validation Studies
A robust validation protocol for catalytic materials screening incorporates systematic experimental design, appropriate statistical analysis, and rigorous documentation. The following workflow provides a structured approach applicable to various catalyst systems.
Detailed Validation Procedure
The validation experiments should be conducted on three different days with three individual plates processed on each day to adequately capture variability and establish reproducibility [67]. Each plate set contains samples that mimic the highest, medium, and lowest expected assay readouts while retaining biological or chemical relevance.
Control Selection and Preparation: The "high" and "low" signal samples are typically chosen as positive and negative controls, establishing the upper and lower boundaries of the assay readout. The "medium" signal sample, often corresponding to the EC~50~ of a reference catalyst or a performance threshold, is crucial for determining the assay's capacity to identify materials with intermediate activity [67]. Fresh control materials should be prepared for each validation day to avoid introducing variability from degraded or aged materials.
Interleaved Plate Design: To identify positional effects and systematic errors, the high, medium, and low signal samples are distributed within plates in an interleaved fashion across the three daily plates: "high-medium-low" (plate 1), "low-high-medium" (plate 2), and "medium-low-high" (plate 3) [67]. This design helps detect artifacts caused by temperature gradients, evaporation patterns, or instrument drift that might affect catalytic activity measurements.
Data Collection and Statistical Analysis: For each plate, raw signal data is collected for all control wells. The data is then analyzed using multiple statistical approaches including calculation of Z'-factor, signal window, coefficient of variation (CV), and means and standard deviations for each control type [67]. Data visualization through scatter plots arranged in well-order sequence is particularly valuable for identifying spatial patterns that indicate systematic errors.
Essential Research Reagents and Materials
Successful implementation of validation protocols requires careful selection and standardization of research reagents and materials. Consistency in reagent quality is particularly critical for catalytic materials research where surface chemistry, impurity effects, and material stability can significantly impact results.
Table 2: Essential Research Reagent Solutions for Catalytic Materials Validation
| Reagent/Material | Function in Validation | Quality Requirements | Storage and Stability |
|---|---|---|---|
| Reference Catalyst Materials | Provides benchmark for high, medium, and low performance signals | Well-characterized composition, structure, and catalytic activity | Stable under recommended storage conditions; protected from moisture/air if sensitive |
| Substrate Solutions | Reaction partners for evaluating catalytic activity | High purity; consistent concentration; minimal impurities | Stability verified under storage conditions; protected from light if photodegradable |
| Detection Reagents | Enable quantification of catalytic activity or product formation | Batch-to-batch consistency; appropriate sensitivity and dynamic range | Fresh preparation or validated stability period; protected from light if necessary |
| Matrix Components | Simulate complex reaction environments when needed | Composition matching intended application; consistent sourcing | Stable for duration of validation studies; checked for degradation products |
| Solvents and Buffers | Provide reaction medium with controlled properties | High purity; appropriate pH and ionic strength; filtered if needed | Fresh preparation preferred; degassed if oxygen-sensitive reactions |
Data Analysis and Interpretation
Statistical Assessment and Acceptance Criteria
The validation data must be rigorously evaluated against predetermined acceptance criteria to determine assay suitability for high-throughput catalyst screening. The following statistical parameters provide a comprehensive assessment of assay performance.
Z'-Factor Calculation: The Z'-factor is calculated using the formula: Z' = 1 - (3 × SD~high~ + 3 × SD~low~) / |Mean~high~ - Mean~low~|, where SD~high~ and SD~low~ are the standard deviations of the high and low controls, and Mean~high~ and Mean~low~ are their respective means [67]. For validation purposes, achieving a Z'-factor greater than 0.4 in all plates is considered acceptable, with values above 0.5 indicating excellent assay robustness suitable for high-throughput catalytic materials screening.
Coefficient of Variation (CV) Requirements: The CV values of the raw high, medium, and low signals should be less than 20% in all nine validation plates [67]. If the low signal fails to meet the CV criteria in any plate, its standard deviation must be less than the standard deviations of the high and medium signals within that plate. Additionally, the standard deviation of the normalized medium signal should be less than 20 in plate-wise calculations.
Pattern Recognition in Spatial Plots: Visualization of data in well-order sequence plots is essential for identifying systematic errors. Common patterns include edge effects (where outer wells show different signals due to temperature gradients), drift (gradual signal changes across the plate), and row/column effects (systematic variations associated with specific plate locations) [67]. These patterns indicate environmental or instrumental issues that must be addressed before assay implementation.
Advanced Data Analysis for Catalytic Materials
In catalyst discovery, additional analytical approaches enhance the interpretation of validation data and provide insights into assay performance under screening conditions.
Implementation in High-Throughput Catalyst Discovery
The integration of validated assays into high-throughput catalyst discovery pipelines requires careful consideration of automation compatibility, throughput requirements, and data management strategies. As catalyst research increasingly incorporates machine learning approaches, the quality of training data generated by validated assays becomes particularly critical [27].
Validated assays provide the reliable, high-quality data necessary for constructing accurate machine learning models that can predict catalytic performance and guide materials optimization [27] [14]. The integration of computational and experimental methods through automated setups creates powerful tools for closed-loop catalyst discovery processes [14]. In this context, assay validation ensures that experimental data used for model training accurately represents the underlying catalytic phenomena, enabling more effective prediction of structure-activity relationships and discovery of novel catalytic materials.
For catalytic materials research, ongoing validation monitoring should be implemented throughout the screening campaign to detect any performance drift caused by reagent lot changes, instrumental calibration shifts, or environmental variations. This quality control framework ensures that the high-throughput data maintains consistency and reliability, enabling confident decision-making throughout the catalyst discovery and optimization process.
Within high-throughput screening methods for catalyst discovery research, two dominant paradigms have emerged: traditional experimental high-throughput screening (HTS) and computational virtual screening (VS). The selection between these approaches fundamentally shapes research design, resource allocation, and discovery outcomes. Traditional HTS employs robotic automation to physically test thousands to millions of compounds rapidly [9], while VS uses computational models to prioritize compounds for synthesis and testing from vast chemical spaces [58] [68]. This application note provides a structured comparison of their performance metrics, detailed protocols for implementation, and practical guidance for researchers seeking to accelerate catalyst discovery.
Performance Metrics and Comparative Analysis
Quantitative Performance Comparison
Table 1: Direct Comparison of Virtual Screening and Traditional HTS Performance Characteristics
| Performance Metric | Virtual Screening (VS) | Traditional HTS |
|---|---|---|
| Typical Hit Rate | 6.7% average (internal portfolio) to 7.6% (academic collaborations) [58] | 0.001% to 0.15% [58] [68] |
| Chemical Space Coverage | 16+ billion compounds in single screening [58] | Thousands to several million compounds [58] |
| Primary Screening Cost | Lower (computational resources only) | High (reagents, compounds, instrumentation) [58] [9] |
| Resource Requirements | Extensive computing (40,000 CPUs, 3,500 GPUs per screen) [58] | Robotic automation, liquid handlers, plate readers [9] |
| Time Efficiency | Days to weeks for library screening | Weeks to months for full library screening |
| Automation Level | Fully automated pipelines available [69] | High degree of robotic automation [9] |
| False Positive Rate | Variable; improved with consensus methods [68] | Significant; requires confirmatory screens [70] |
| Application in Catalyst Discovery | Demonstrated for bimetallic catalysts [4] | Established history in catalyst discovery [71] |
Hit Rate Analysis and Enrichment
Virtual screening consistently demonstrates higher hit rates than traditional HTS. A large-scale study of 318 targets reported an average hit rate of 6.7% for internal projects and 7.6% for academic collaborations using deep learning-based VS [58]. In contrast, traditional HTS typically yields hit rates between 0.001% and 0.15% [58] [68]. This dramatic difference represents a several-hundred-fold enrichment factor for VS approaches.
The superior hit rates of VS stem from its predictive preselection capability. Unlike HTS, which tests compounds indiscriminately, VS employs computational filters to prioritize candidates most likely to be active. In catalyst discovery, this approach has successfully identified novel bimetallic catalysts using electronic structure similarity as a key descriptor [4]. One study screened 4,350 bimetallic alloy structures computationally and proposed eight candidates, four of which demonstrated catalytic properties comparable to palladium, including the previously unreported Ni61Pt39 catalyst [4].
Table 2: Specialized Performance Metrics in Catalyst Discovery Screening
| Specialized Metric | Computational-Experimental Screening | AI-Driven Iterative Screening |
|---|---|---|
| Screening Efficiency | 4 of 8 predicted catalysts validated experimentally [4] | 70-90% of actives found screening 35-50% of library [62] |
| Descriptor Effectiveness | Electronic DOS similarity successfully predicted catalytic performance [4] | Machine learning models identify complex activity patterns |
| Cost Normalization | 9.5-fold enhancement in cost-normalized productivity for Ni61Pt39 vs Pd [4] | Reduced screening costs through prioritized compound selection |
| Scaffold Novelty | Discovery of unreported Ni-Pt catalyst for H2O2 synthesis [4] | Identifies novel drug-like scaffolds beyond known bioisosteres [58] |
Experimental Protocols
Virtual Screening Protocol for Catalyst Discovery
This protocol adapts structure-based virtual screening methodologies for catalyst discovery applications, based on established computational-experimental pipelines [4] [69].
Stage 1: System Preparation and Library Generation
- Receptor Preparation: For catalyst discovery, define the catalytic surface or active site. For bimetallic catalysts, construct crystal structures of candidate alloys. Remove water molecules and additives, add hydrogen atoms, and assign appropriate charges [68].
- Active Site Definition: Define the grid box encompassing the catalytic surface or active site. For metallic catalysts, this typically includes the surface atoms involved in reactant adsorption and transition state stabilization [4].
- Compound Library Generation: For catalyst discovery, libraries may contain potential ligand structures or bimetallic combinations. For 1:1 binary systems, consider 10 ordered phases (B1, B2, B3, B4, B11, B19, B27, B33, L10, L11) [4]. Generate 3D conformers using tools like OMEGA software with appropriate energy windows and conformer limits [68].
Stage 2: Virtual Screening Execution
- Molecular Docking: Perform docking with software such as DOCK v6.6. For catalyst discovery, this may involve placing probe molecules on catalytic surfaces. Set parameters to allow sufficient orientational sampling while controlling computational expense [68].
Scoring and Ranking: Employ multiple scoring functions (e.g., PB/SA Score, AMBER Score, GB/SA Score) to evaluate interactions. For catalyst discovery, electronic density of states (DOS) similarity can serve as a powerful descriptor [4]. Calculate DOS similarity using the formula:
({{{\mathrm{{\Delta}}} DOS}}{2 - 1}} = \left{ {{\int} {\left[ {{{{\mathrm{DOS}}}}2\left( E \right) - {{{\mathrm{DOS}}}}_1\left( E \right)} \right]^2} {{{\mathrm{g}}}}\left( {E;{\upsigma}} \right){{{\mathrm{d}}}}E} \right}^{\frac{1}{2}})
where ({{{\mathrm{g}}}}\left( {E;\sigma } \right) = \frac{1}{{\sigma \sqrt {2\pi } }}{{{\mathrm{e}}}}^{ - \frac{{\left( {E - E_{{{\mathrm{F}}}}} \right)^2}}{{2\sigma ^2}}}) [4].
- Consensus Ranking: Implement consensus approaches by combining ranks from multiple scoring functions using arithmetic or geometric means to improve hit identification [68].
Stage 3: Post-Processing and Experimental Validation
- Cluster Analysis: Group top-ranked compounds by structural or electronic similarity to ensure diversity in selected candidates [58].
- Synthetic Feasibility Assessment: Evaluate the synthetic accessibility of top-ranked candidates, considering thermodynamic stability (formation energy ΔEf < 0.1 eV for bimetallic catalysts) [4].
- Experimental Validation: Synthesize and test top candidates. For catalysts, evaluate performance in target reactions and compare to reference catalysts [4].
Traditional HTS Protocol for Catalyst Discovery
This protocol outlines a standard HTS workflow adapted for catalyst discovery applications.
Stage 1: Assay Development and Validation
- Assay Design: Develop a robust, miniaturized assay system compatible with automation. For catalyst discovery, this may involve monitoring reaction products or substrate conversion.
- Validation: Determine Z-factor to quantify assay quality and reliability. Implement appropriate positive and negative controls [9].
- Automation Programming: Program robotic liquid handlers and plate readers for unattended operation of screening steps.
Stage 2: Screening Execution
- Plate Preparation: Dispense compound libraries into assay-ready plates using acoustic dispensing or pin tools.
- Reaction Initiation: Add substrates or reagents to initiate catalytic reactions simultaneously across plates.
- Signal Detection: Monitor reaction progress using appropriate detection methods (absorbance, fluorescence, luminescence) at defined timepoints [9].
Stage 3: Hit Identification and Confirmation
- Data Analysis: Process raw data to calculate conversion rates or turnover frequencies for each catalyst.
- Hit Selection: Apply statistical thresholds or activity cutoffs to identify primary hits. For catalyst discovery, this may include minimum turnover numbers or selectivity criteria.
- Hit Confirmation: Re-test primary hits in dose-response or time-course experiments to confirm activity [70].
Workflow Visualization
Virtual vs Traditional Screening Workflows
The Scientist's Toolkit
Essential Research Reagent Solutions
Table 3: Key Research Reagents and Materials for Screening Technologies
| Reagent/Material | Function | Application Context |
|---|---|---|
| Structure-Based VS Software (DOCK, AutoDock) | Predicts binding poses and scores ligand-receptor interactions | Virtual screening for target-binding catalysts [68] |
| Ligand-Based VS Tools (QSAR, Pharmacophore) | Identifies novel ligands based on known active compounds | Virtual screening when structural data is unavailable [68] |
| Automated Liquid Handlers | Enables high-speed, precise reagent dispensing | Traditional HTS assay setup and execution [9] |
| Microplate Readers | Detects assay signals (absorbance, fluorescence) | Traditional HTS signal detection and quantification [9] |
| Compound Management Systems | Stores and tracks screening compound libraries | Traditional HTS library maintenance and distribution [9] |
| High-Content Screening Instruments | Captures multiparametric cellular or morphological data | Complex phenotypic screening in catalyst discovery |
| Consensus Scoring Functions | Combines multiple scoring algorithms to improve hit prediction | Virtual screening post-processing to reduce false positives [68] |
| Synthesis-on-Demand Libraries | Provides access to vast, unexplored chemical space | Virtual screening follow-up for compound synthesis [58] |
Discussion and Implementation Guidelines
Strategic Integration in Catalyst Discovery
The complementary strengths of virtual and traditional screening suggest that hybrid approaches often yield optimal results in catalyst discovery. Virtual screening excels at exploring vast chemical spaces cost-effectively, while traditional HTS provides empirical validation with lower rates of false positives due to experimental verification.
For resource-constrained environments, virtual screening offers access to significantly larger chemical spaces than would be possible with traditional HTS alone. The demonstrated ability of VS to identify novel catalyst scaffolds, such as Ni-Pt bimetallic catalysts for H2O2 synthesis [4], highlights its potential for innovation in catalyst discovery. Furthermore, AI-driven iterative screening approaches that combine machine learning with experimental testing can enhance hit finding while reducing the number of compounds screened [62].
Future Directions
The integration of artificial intelligence and machine learning is transforming both virtual and traditional screening paradigms. Deep learning systems like AtomNet demonstrate the potential to substantially replace HTS as the primary screening method [58]. These systems successfully identify novel scaffolds across diverse target classes without requiring known binders, high-quality crystal structures, or manual compound selection [58].
For catalyst discovery, descriptor development remains crucial. Electronic density of states similarity has proven effective for bimetallic catalysts [4], suggesting that electronic structure descriptors may play an increasingly important role in computational catalyst screening. As these methodologies mature, the distinction between virtual and experimental screening continues to blur, paving the way for more integrated, efficient discovery workflows that leverage the complementary strengths of both approaches.
Application Note
High-Throughput Screening (HTS) is a cornerstone of modern drug discovery and materials research, enabling the rapid testing of thousands of chemical compounds or materials [10] [14]. Cross-laboratory validation is a critical process to ensure that HTS data generated in different locations are reliable, reproducible, and comparable. This is particularly vital in catalyst discovery research, where inconsistent results can significantly hinder development cycles [27]. The transition from traditional single-concentration HTS to Quantitative HTS (qHTS), which generates full concentration-response curves for thousands of compounds, offers the prospect of lower false-positive and false-negative rates [10]. However, this approach introduces significant statistical challenges in nonlinear modeling and parameter estimation that must be systematically addressed through robust validation frameworks.
Key Challenges in Cross-Laboratory HTS
- Parameter Estimation Variability: In qHTS, estimating parameters like AC₅₀ (half-maximal activity concentration) and Eₘₐₓ (maximal response) from the Hill equation model is highly variable when concentration ranges fail to define both asymptotes of the response curve [10]. Simulation studies show that AC₅₀ confidence intervals can span several orders of magnitude under suboptimal conditions [10].
- Systematic Error Introduction: Multiple factors can introduce systematic bias, including well location effects, compound degradation, signal flare across wells, and compound carryover between plates [10].
- Data Quality and Standardization: For machine learning applications in catalysis, model performance is highly dependent on data quality and volume. Inconsistent data acquisition and standardization across laboratories remain major challenges [27].
Statistical Foundations for Validation
The core statistical challenge in qHTS validation stems from the nonlinear least squares parameter estimation within standard study designs. The widely used Hill equation:
[Ri = E0 + \frac{(E∞ - E0)}{1 + \exp{-h[\log Ci - \log AC{50}]}}]
where:
- (Ri) = measured response at concentration (Ci)
- (E_0) = baseline response
- (E_∞) = maximal response
- (h) = shape parameter
- (AC_{50}) = concentration for half-maximal response
Parameter estimates obtained from this model show high variability when the range of tested concentrations fails to include at least one of the two asymptotes, responses are heteroscedastic, or concentration spacing is suboptimal [10].
Table 1: Impact of Experimental Replicates on Parameter Estimation Precision in Simulated qHTS Data
| True AC₅₀ (μM) | True Eₘₐₓ (%) | Number of Replicates (n) | Mean [95% CI] for AC₅₀ Estimates | Mean [95% CI] for Eₘₐₓ Estimates |
|---|---|---|---|---|
| 0.001 | 25 | 1 | 7.92e-05 [4.26e-13, 1.47e+04] | 1.51e+03 [-2.85e+03, 3.1e+03] |
| 0.001 | 25 | 3 | 4.70e-05 [9.12e-11, 2.42e+01] | 30.23 [-94.07, 154.52] |
| 0.001 | 25 | 5 | 7.24e-05 [1.13e-09, 4.63] | 26.08 [-16.82, 68.98] |
| 0.001 | 50 | 1 | 6.18e-05 [4.69e-10, 8.14] | 50.21 [45.77, 54.74] |
| 0.001 | 50 | 3 | 1.74e-04 [5.59e-08, 0.54] | 50.03 [44.90, 55.17] |
| 0.001 | 100 | 1 | 1.99e-04 [7.05e-08, 0.56] | 85.92 [-1.16e+03, 1.33e+03] |
| 0.001 | 100 | 5 | 7.24e-04 [4.94e-05, 0.01] | 100.04 [95.53, 104.56] |
| 0.1 | 50 | 1 | 0.10 [0.04, 0.23] | 50.64 [12.29, 88.99] |
| 0.1 | 50 | 5 | 0.10 [0.06, 0.16] | 50.07 [46.44, 53.71] |
Protocol: Cross-Laboratory HTS Validation for Catalyst Discovery
Experimental Design and Plate Configuration
Principle: Establish standardized plate layouts and controls that account for positional effects and enable normalization across laboratories.
Materials:
- 1536-well plates (or 384-well for lower throughput)
- Reference catalysts with established performance metrics
- Negative control (inactive material/solvent)
- Positive control (known active catalyst)
Procedure:
- Plate Mapping:
- Distribute reference catalysts in a symmetrical pattern across the plate to control for edge effects and spatial biases.
- Include minimum (negative control) and maximum (positive control) response controls in quadruplicate.
- Utilize inter-plate calibration standards to normalize responses across screening runs.
- Concentration Range Selection:
- Implement a 15-point concentration series with 1:3 serial dilutions to adequately define the concentration-response relationship [10].
- Ensure concentration ranges extend beyond both asymptotes where possible, particularly covering the baseline (E₀) and maximal response (Eₙ).
Automated Solid Handling and Liquid Transfer
Principle: Implement automated systems to minimize human error and improve reproducibility, especially at micro-scales.
Materials:
- CHRONECT XPR automated powder dosing system (or equivalent)
- Liquid handling robots with non-contact dispensers
- Inert atmosphere gloveboxes for air-sensitive catalysts
Procedure:
- Solid Dosing:
- Utilize automated powder dispensing systems capable of handling 1 mg to several grams with <10% deviation at low masses (<10 mg) and <1% deviation at higher masses (>50 mg) [72].
- Program dosing protocols for transition metal complexes, organic starting materials, and inorganic additives.
- For 96-well plates, employ automated systems to eliminate significant human errors common in manual weighing at small scales [72].
- Liquid Transfer:
- Implement calibrated liquid handlers with integrated balance verification.
- Include evaporation control measures such as resealable gaskets on tube manifolds [72].
Data Analysis and Quality Control
Principle: Apply standardized statistical approaches to identify and correct for systematic biases while quantifying uncertainty in parameter estimates.
Procedure:
- Response Normalization:
- Normalize raw response data using plate-based positive and negative controls: [ R{\text{normalized}} = \frac{R{\text{raw}} - R{\text{negative}}}{R{\text{positive}} - R_{\text{negative}}} \times 100\% ]
- Apply location-based correction factors derived from reference catalyst signals.
Curve Fitting and Classification:
- Fit normalized concentration-response data to the Hill equation using nonlinear least squares regression.
- Implement quality thresholds for curve fits (e.g., R² > 0.9, confidence interval width on AC₅₀ < 2 log units).
- Classify curves based on completeness (both asymptotes defined, only one asymptote defined, or no asymptotes defined) [10].
Cross-Laboratory Comparison:
- Calculate intraclass correlation coefficients (ICC) for key parameters (AC₅₀, Eₘₐₓ, Hill slope) across participating laboratories.
- Establish equivalence margins based on biological relevance (typically ±0.5 log units for AC₅₀).
Table 2: Essential Research Reagent Solutions for HTS Catalyst Discovery
| Reagent Category | Specific Examples | Function in HTS Workflow |
|---|---|---|
| Reference Catalysts | Well-characterized transition metal complexes (e.g., Pd(PPh₃)₄, RuCl₂(PPh₃)₃ | System calibration and inter-laboratory performance benchmarking |
| Catalyst Libraries | Diverse transition metal complexes, organic catalysts, inorganic materials | Screening for novel catalytic activity across chemical space |
| Substrate Mixtures | Functionalized aromatic compounds, aliphatic precursors, specialized chromogens | Standardized reaction components for consistent activity assessment |
| Positive Control Standards | Known high-performance catalysts for target reactions | Maximum activity reference for data normalization |
| Negative Control Materials | Inert fillers, solvent-only blanks, inactive analogous compounds | Baseline signal determination and background subtraction |
| Automated Powder Dosing Systems | CHRONECT XPR with multiple dosing heads [72] | Precise, reproducible solid handling at mg scales |
| High-Sensitivity Detectors | Plate readers with luminescence, absorbance, or fluorescence detection | Measurement of catalytic reaction outputs at low volumes |
Validation Metrics and Reporting
Principle: Establish quantitative metrics to assess cross-laboratory reproducibility and define acceptance criteria.
Procedure:
- Calculate Key Metrics:
- Inter-laboratory CV: Coefficient of variation for AC₅₀ estimates across participating laboratories (<35% for acceptable reproducibility).
- Parameter Confidence Intervals: Width of 95% confidence intervals for AC₅₀ and Eₘₐₓ estimates.
- False Positive/Negative Rates: Proportion of inactive compounds classified as active and vice versa.
- Generate Validation Report:
- Document all protocol deviations and environmental conditions.
- Report quantitative reproducibility metrics for each reference catalyst.
- Provide raw and normalized data sets for future meta-analyses.
Implementation Case Study: AstraZeneca HTE Program
AstraZeneca's 20-year implementation of High-Throughput Experimentation (HTE) provides a successful framework for cross-laboratory validation [72]. Key achievements include:
- Throughput Enhancement: Increased screening capacity from 20-30 reactions per quarter to 50-85 reactions per quarter, with conditions evaluated growing from <500 to ~2000 per quarter [72].
- Automated Solid Weighing: Implementation of CHRONECT XPR systems enabled efficient dosing of diverse solids (transition metal complexes, organic starting materials, inorganic additives) with high precision [72].
- Organizational Integration: Co-location of HTE specialists with medicinal chemists fostered a cooperative rather than service-led approach, enhancing protocol adoption and data interpretation [72].
This systematic approach to cross-laboratory validation addresses the fundamental statistical challenges in qHTS while providing a standardized framework for accelerating catalyst discovery research.
Within high-throughput screening (HTS) methods for catalyst discovery research, the ability to leverage public data repositories has become increasingly critical for accelerating innovation. The growth of academic HTS screening centers and the increasing move to academia for early stage discovery suggest a great need for the informatics tools and methods to mine such data and learn from it [73]. Public HTS data repositories provide access to large structure-activity datasets that can significantly reduce redundant experimentation and guide research directions. However, the value of these repositories is entirely dependent on the completeness and quality of the data they contain, necessitating rigorous assessment protocols before use in catalyst discovery pipelines.
The complexity of multidimensional chemical space in asymmetric catalysis presents particular challenges [74]. With the number of possible combinations between catalysts, substrates, additives, and reaction conditions constituting a vast chemical space, researchers must be able to trust the quality of public HTS data to build reliable computational models and make informed decisions about which regions of chemical space to explore experimentally. This application note establishes detailed protocols for evaluating public HTS data repositories, with specific considerations for catalyst discovery applications.
Data Quality Framework for HTS Repositories
A comprehensive assessment of HTS data repositories requires evaluation across multiple dimensions of data quality. The framework presented here adapts structured approaches from observational health research and assay validation to the specific needs of catalysis research [75]. This systematic evaluation ensures that data extracted from public repositories will support robust and reproducible scientific conclusions.
Table 1: Data Quality Framework for HTS Repositories
| Quality Dimension | Assessment Focus | Key Indicators |
|---|---|---|
| Integrity | Compliance with structural and technical requirements | Structural data set errors, relational integrity, value format errors |
| Completeness | Presence of expected data values | Crude missingness, qualified missingness, metadata completeness |
| Consistency | Adherence to predefined rules and ranges | Contradictions, inadmissible values, temporal consistency |
| Accuracy | Correspondence to true values | Distributional accuracy, associative accuracy, experimental validation |
Integrity and Completeness Requirements
The integrity dimension ensures that HTS data complies with pre-specified structural requirements—a fundamental prerequisite for any subsequent analysis [75]. Assessment should verify that data sets contain the expected number of records, variables follow defined formats, and relationships between connected data sets (e.g., compound structures linked to activity measurements) are properly maintained. Without structural integrity, automated processing and analysis pipelines will fail or produce misleading results.
The completeness dimension evaluates whether expected data values are available, with particular attention to patterns of missing data [75]. In catalyst discovery HTS data, this includes assessing missing values for key experimental parameters (e.g., temperature, solvent, catalyst loading), reaction outcomes (e.g., yield, enantiomeric excess), and structural descriptors. The critical distinction between "crude missingness" (simple absence of data) and "qualified missingness" (documented reasons for absence) must be recognized, as the latter provides crucial context for interpreting screening results.
Experimental Protocols for Quality Assessment
Protocol 1: Repository-Level Completeness Audit
Purpose: To quantitatively assess the completeness and coverage of HTS data within a public repository.
Materials:
- Repository access credentials or API tokens
- Computational environment (Python/R) for data retrieval and analysis
- Metadata schema defining expected data elements
- Standardized documentation template
Procedure:
- Define Assessment Scope: Identify specific data domains for evaluation (e.g., asymmetric catalysis, photoredox catalysis, organocatalysis).
- Inventory Data Elements: Catalog available data types across the defined scope, including reaction schemas, catalyst structures, experimental conditions, and performance metrics.
- Quantify Completeness Metrics: For each data element, calculate completeness percentages: (Number of records with data present / Total number of records) × 100.
- Analyze Missingness Patterns: Determine whether missing data occurs randomly or shows systematic patterns (e.g., certain catalyst classes or reaction types underrepresented).
- Document Findings: Record completeness metrics using standardized templates and flag critical gaps that may limit utility for specific research applications.
Table 2: Key Research Reagent Solutions for HTS Quality Assessment
| Reagent/Resource | Function | Application Notes |
|---|---|---|
| CDD Vault Platform | HTS data management and visualization | Enables mining, secure sharing, and visualization of HTS data; includes Bayesian modeling capabilities [73] |
| DataquieR Package | Computational data quality assessment | R package implementing 34 data quality indicators for structured assessment [75] |
| Ion Mobility-Mass Spectrometry | Ultra-high-throughput enantiomeric excess analysis | Enables ~1000 reactions/day analysis speed with <±1% median error for asymmetric catalysis [74] |
| Chiral Resolving Reagent D3 | Derivatization for enantiomer separation | Enables diastereomer formation for IM-MS analysis; contains azide group for CuAAC chemistry [74] |
| Assay Guidance Manual | HTS assay validation framework | Provides statistical standards for assay performance validation [76] |
Protocol 2: Experimental Consistency Validation
Purpose: To verify internal consistency of HTS data and identify contradictions or outliers.
Materials:
- Reference data sets with known quality
- Statistical software (R, Python with pandas/sci-kit learn)
- Domain knowledge base for expected relationships
Procedure:
- Define Validation Rules: Establish domain-specific rules for data consistency (e.g., enantiomeric excess values must range from -100% to +100%, reaction yields cannot exceed 100%).
- Implement Automated Rule Checking: Develop scripts to identify records violating defined rules.
- Assess Temporal Consistency: For time-series HTS data, verify that measurement protocols remain consistent across different screening campaigns.
- Identify Value Contradictions: Flag records with logically inconsistent values (e.g., high enantioselectivity reported with minimal conversion).
- Document Anomalies: Create an annotated log of inconsistencies for potential repository curators or to inform usage constraints.
Protocol 3: Cross-Repository Accuracy Benchmarking
Purpose: To evaluate accuracy of HTS data through comparison across multiple repositories or against validated reference data.
Materials:
- Access to multiple HTS repositories (e.g., public and proprietary)
- Validated reference compounds with known performance
- Statistical analysis tools for comparison
Procedure:
- Select Benchmark Compounds: Identify well-characterized catalysts or reactions with reliable reference data.
- Extract Comparative Data: Retrieve corresponding data from target repositories.
- Quantitative Comparison: Calculate concordance metrics between repository data and reference values.
- Assess Associative Accuracy: Evaluate whether expected structure-activity relationships are preserved in repository data.
- Generate Accuracy Report: Document systematic biases, measurement discrepancies, and overall reliability estimates.
Implementation and Tools
Computational Implementation
The data quality framework can be implemented using the dataquieR package in R, which provides functions for computing data quality indicators based on study data and metadata [75]. The package supports generation of R Markdown reports that provide overviews of data quality assessment results, including tables and graphs that highlight unexpected findings at the level of individual observations. This facilitates subsequent data management and cleaning steps essential for preparing HTS data for catalyst discovery research.
For specialized catalysis applications, CDD Vault provides web-based data mining and visualization modules specifically designed for HTS data [73]. The platform enables researchers to manipulate and visualize thousands of molecules in real time through interactive scatterplots, histograms, and other visualizations that maintain awareness of higher-dimensional context. This capability is particularly valuable for exploring complex structure-activity relationships in catalyst discovery.
Workflow Visualization
HTS Data Quality Assessment Workflow
Application to Catalyst Discovery
The assessment framework has particular significance for asymmetric catalyst discovery, where public HTS data can guide exploration of complex multidimensional chemical spaces. Recent advances in ultra-HTS approaches enable mapping of more than 1600 reactions in asymmetric alkylation of aldehydes with organocatalysis and photocatalysis [74]. Without rigorous quality assessment, however, researchers risk building models or making discovery decisions based on unreliable data.
The enantiomeric excess (ee) determination methods used to generate public HTS data require specific scrutiny. Traditional chiral chromatography, while accurate, creates throughput limitations that may influence data completeness in large-scale screenings [74]. Emerging methods like ion mobility-mass spectrometry with diastereoisomerization strategies achieve ultrafast analysis (~1000 reactions/day) with high accuracy (median error < ±1%), but researchers must verify which analytical methods underlie public HTS data when assessing its suitability for their applications.
For catalyst discovery research, specific quality considerations include:
- Catalyst structural integrity: Verification of stereochemistry and molecular representation
- Reaction condition documentation: Completeness of parameters influencing catalytic performance
- Performance metric standardization: Consistency in reporting conversion, yield, and enantioselectivity
- Control experiment documentation: Presence of appropriate positive and negative controls
This application note provides detailed protocols for evaluating the completeness and quality of public HTS data repositories, with specific considerations for catalyst discovery research. The structured framework addresses integrity, completeness, consistency, and accuracy dimensions through implementable experimental protocols. As high-throughput approaches systematically change how catalyst research is conducted [71], ensuring the quality of public screening data becomes increasingly critical for accelerating innovation and reducing time to discovery.
The tools and methodologies described enable researchers to make informed decisions about which public HTS repositories to incorporate into their catalyst discovery pipelines and how to account for quality limitations when building computational models or designing screening campaigns. Through standardized assessment and documentation of data quality, the catalysis research community can more effectively leverage growing public data assets to advance discovery objectives.
{ARTICLE CONTENT START}
Comparative Analysis of Screening Outcomes Across Different Catalyst Classes
High-throughput screening (HTS) has become an indispensable strategy in modern catalyst discovery, systematically accelerating the navigation of vast compositional and reaction spaces that are infeasible to explore through traditional one-variable-at-a-time experimentation [26] [71]. These approaches leverage automation, miniaturized parallel reactors, and integrated analytics to rapidly evaluate catalyst performance across multiple criteria, including activity, selectivity, and stability [77]. The paradigm is shifting from endpoint analysis to time-resolved kinetic profiling, providing deeper mechanistic insights alongside performance data [26]. This application note provides a comparative analysis of screening outcomes and detailed protocols for diverse catalyst classes, including nitrogen-doped carbons, bimetallic alloys, and heterogeneous transition metal complexes, framing the discussion within the context of a broader thesis on advanced discovery methodologies.
Screening Outcomes and Performance Metrics
The performance of catalysts is highly dependent on their composition and structure. The following table summarizes key quantitative outcomes from high-throughput screening studies across different catalyst classes, highlighting their performance in specific reactions.
Table 1: Comparative Catalyst Performance from High-Throughput Screening Studies
| Catalyst Class | Target Reaction | Key Performance Metrics | Top-Performing Candidate(s) | Screening Method | Reference |
|---|---|---|---|---|---|
| N-doped Carbon Materials | Bisphenol A (BPA) Degradation via Persulfate Activation | BPA degradation efficiency; Influence of N-functional groups | Model-predicted efficient N-doped carbons (Specific candidates not listed) | Machine Learning (ML) & Causal Inference on 182 experimental sets [78] | [78] |
| Bimetallic Alloys | H₂O₂ Direct Synthesis | Catalytic performance comparable to Pd; Cost-Normalized Productivity (CNP) | Ni₆₁Pt₃₉ (9.5x CNP vs. Pd), Au₅₁Pd₄₉, Pt₅₂Pd₄₈, Pd₅₂Ni₄₈ | High-Throughput DFT (4350 structures), DOS similarity descriptor [4] | [4] |
| Heterogeneous Catalysts (Library) | Nitro-to-Amine Reduction | Reaction completion time; Yield; Selectivity (based on isosbestic point stability) | Cu@Charcoal (representative example); Specific top performer not identified | Fluorogenic Assay, 24-well plate, 114 catalysts screened [26] | [26] |
| Metallic Alloys (Computational) | CO₂ to Methanol Conversion | Adsorption Energy Distributions (AEDs) for *H, *OH, *OCHO, *OCH₃ | ZnRh, ZnPt₃ (New proposed candidates) | ML Force Fields (OCP), AED analysis of ~160 materials [38] | [38] |
The screening of bimetallic alloys for H₂O₂ synthesis demonstrated that electronic structure similarity to a known proficient catalyst (Pd) is a powerful descriptor for discovery [4]. The discovery of Ni₆₁Pt₃₉, which significantly outperforms Pd on a cost-normalized basis, highlights the potential of HTS to identify not only active but also economically superior catalysts [4]. In environmental catalysis, a combined machine learning and causal inference approach for N-doped carbon materials efficiently identified key nitrogen functional groups that enhance persulfate activation for BPA degradation, demonstrating how data-driven methods can manage complex feature spaces [78]. Furthermore, a fluorogenic assay for nitro-reduction showcased the utility of real-time, optical kinetic profiling in screening a large library of 114 diverse catalysts, enabling the assessment of activity, selectivity, and the presence of intermediates [26]. Finally, a computational screening of metallic alloys for CO₂ to methanol conversion employed a novel Adsorption Energy Distribution (AED) descriptor, leading to the proposal of new promising candidates like ZnRh and ZnPt₃, which exhibit favorable energy landscapes for the reaction [38].
Detailed Experimental Protocols
Protocol 1: High-Throughput Screening of Electrocatalysts with Stability Assessment
This protocol details an automated setup for simultaneously evaluating electrocatalyst activity and stability [77].
- Key Equipment: Automated electrochemical flow cell coupled to an Inductively Coupled Plasma Mass Spectrometer (ICP-MS); Liquid-handling robot.
- Procedure:
- Library Preparation: Prepare a library of catalyst inks, typically transition metal oxides. Use a liquid-handling robot to deposit inks onto a well-plate working electrode.
- System Calibration: Calibrate the ICP-MS and establish a flow-injection system connecting the electrochemical cell to the ICP-MS.
- Activity Screening: Perform automated linear sweep voltammetry (LSV) or chronoamperometry on each catalyst spot in the flow cell to measure activity (e.g., for the Oxygen Evolution Reaction - OER).
- Stability Screening: Simultaneously, monitor the dissolution of catalyst material (metal ions) in the electrolyte effluent using ICP-MS.
- Data Processing: Use custom software (e.g., Python-based for image processing and coordinate mapping) to correlate electrochemical activity with metal dissolution rates for each catalyst spot [77].
Protocol 2: Fluorogenic Kinetic Screening for Nitro-Reduction
This protocol describes a real-time, optical method for screening catalyst performance in the reduction of nitro groups to amines [26].
- Key Equipment: 24-well polystyrene plate; Multi-mode microplate reader (e.g., Biotek Synergy HTX) capable of fluorescence and absorbance measurements.
- Reagents: Nitronaphthalimide (NN) probe (non-fluorescent); Catalysts (e.g., Cu@charcoal); Reducing agent (e.g., 1.0 M aqueous N₂H₄); Amine product (AN) for reference wells.
- Procedure:
- Plate Setup: Populate a 24-well plate with 12 reaction wells (containing catalyst, NN, and reductant) and 12 paired reference wells (containing catalyst, AN product, and reductant).
- Initiate Reaction: After adding all components, place the plate in the reader.
- Kinetic Data Collection: Program the reader to cycle every 5 minutes for 80 minutes: orbital shaking (5 s), fluorescence reading (ex. 485 nm, em. 590 nm), and full absorbance scan (300–650 nm).
- Data Analysis:
- Convert raw data to concentration-like units using the reference well values.
- Plot kinetic curves for the decay of the nitro-absorbance peak (~350 nm) and the growth of the amine-absorbance (~430 nm) and fluorescence signals.
- Monitor the isosbestic point (~385 nm); instability indicates side reactions or changing conditions.
- Identify the presence of intermediates (e.g., azo/azoxy forms absorbing at ~550 nm) to score selectivity [26].
Protocol 3: Computational Screening Using Adsorption Energy Distributions (AEDs)
This protocol outlines a high-throughput computational workflow for screening catalysts using machine-learned force fields [38].
- Key Software/Data: Open Catalyst Project (OCP) frameworks and pre-trained models (e.g., equiformer_V2); Materials Project database; DFT codes (e.g., VASP).
- Procedure:
- Search Space Selection: Curate a list of potential metallic elements and their stable bimetallic alloys from materials databases (e.g., 18 elements leading to 216 structures).
- Surface Generation: For each material, generate multiple low-index surface facets (Miller indices from -2 to 2) and identify the most stable termination for each facet.
- Adsorbate Configuration: Engineer surface-adsorbate configurations for key reaction intermediates (e.g., for CO₂ to methanol: *H, *OH, *OCHO, *OCH₃) on all relevant surface sites.
- Energy Calculation: Use OCP MLFFs to relax the adsorbate-surface configurations and calculate adsorption energies. This step is ~10⁴ times faster than direct DFT.
- Validation: Benchmark MLFF-predicted adsorption energies against explicit DFT calculations for a subset of materials (e.g., Pt, Zn) to ensure reliability (target MAE < 0.2 eV).
- Descriptor Construction & Analysis: For each material, aggregate all calculated adsorption energies for an adsorbate into an Adsorption Energy Distribution (AED). Compare AEDs of new candidates to those of known catalysts using similarity metrics like the Wasserstein distance to identify promising candidates [38].
Workflow Visualization
The following diagram illustrates a generalized high-level workflow for catalyst discovery that integrates the computational and experimental protocols discussed in this note.
Diagram 1: Integrated Catalyst Discovery Workflow. This chart outlines the synergistic relationship between computational screening (green) and experimental high-throughput screening (blue) pathways, culminating in data-driven candidate selection and validation.
The Scientist's Toolkit: Essential Research Reagents and Materials
The following table lists key reagents, materials, and tools essential for executing the high-throughput screening protocols described in this document.
Table 2: Essential Reagents and Tools for High-Throughput Catalyst Screening
| Item Name | Function/Application | Example/Specification | Reference |
|---|---|---|---|
| Fluorogenic Probe (e.g., Nitronaphthalimide - NN) | Optical reaction monitoring; "Off-on" fluorescence upon reduction from nitro to amine form. | Enables real-time kinetic profiling in well-plate readers. | [26] |
| Microplate Reader | Automated, parallel measurement of fluorescence and absorbance in multi-well plates. | Biotek Synergy HTX or equivalent; capable of orbital shaking and spectral scanning. | [26] |
| Automated Electrochemical Flow Cell | High-throughput measurement of electrocatalyst activity (e.g., OER). | Coupled to ICP-MS for simultaneous stability assessment via catalyst dissolution monitoring. | [77] |
| Pre-trained Machine-Learned Force Fields (MLFFs) | Accelerated computation of adsorption energies and structural relaxations. | Open Catalyst Project (OCP) models (e.g., equiformer_V2); ~10⁴ speedup vs. DFT. | [38] |
| Density Functional Theory (DFT) Codes | Gold-standard computational method for calculating electronic structures and energies. | VASP; used for generating reference data and benchmarking MLFFs. | [4] [38] |
| Materials Database | Source of crystal structures for generating initial catalyst models and search spaces. | Materials Project; Provides curated, computationally characterized crystal structures. | [4] [38] |
{ARTICLE CONTENT END}
Conclusion
The integration of high-throughput computational and experimental methods represents a transformative approach to catalyst discovery, significantly accelerating the identification of novel materials. The synergy between machine learning, density functional theory, and automated experimental setups has enabled more efficient exploration of vast chemical spaces, though challenges in data quality, validation, and addressing underrepresented material classes remain. Future advancements will likely focus on improved physics-informed ML models, standardized data protocols, and enhanced global collaboration. As these methodologies mature, they promise to deliver cost-competitive, high-performance catalysts crucial for sustainable energy technologies and chemical processes, ultimately bridging the gap between laboratory discovery and practical application in biomedical and industrial contexts.
References
- 1. Catalysis [https://en.wikipedia.org/wiki/Catalysis]
- 2. Catalysis | PNNL [https://www.pnnl.gov/explainer-articles/catalysis]
- 3. DOE Explains...Catalysts [https://www.energy.gov/science/doe-explainscatalysts]
- 4. High-throughput computational-experimental screening ... [https://www.nature.com/articles/s41524-021-00605-6]
- 5. 14.7: Catalysis [https://chem.libretexts.org/Bookshelves/General_Chemistry/Map%3A_Chemistry_-_The_Central_Science_(Brown_et_al.)/14%3A_Chemical_Kinetics/14.07%3A_Catalysis]
- 6. Towards Experimental Handbooks in Catalysis [https://link.springer.com/article/10.1007/s11244-020-01380-2]
- 7. Autonomous high-throughput computations in catalysis [https://www.sciencedirect.com/science/article/pii/S266710932200104X]
- 8. Digital Barcodes for High-Throughput Screening - PMC [https://pmc.ncbi.nlm.nih.gov/articles/PMC11835184/]
- 9. High Throughput Screening (HTS) Market Size 2025-2029 [https://www.technavio.com/report/high-throughput-screening-market-industry-analysis]
- 10. Quantitative high-throughput screening data analysis [https://pmc.ncbi.nlm.nih.gov/articles/PMC4375054/]
- 11. A Data Analysis Pipeline Accounting for Artifacts in Tox21 ... [https://www.sciencedirect.com/science/article/pii/S2472555222072525]
- 12. Optimal high-throughput virtual screening pipeline for ... [https://www.sciencedirect.com/science/article/pii/S2589004222020089]
- 13. Introduction to High Throughput Screening [https://www.biologic.net/topics/introduction-to-high-throughput-screening/]
- 14. High throughput computational and experimental methods for accelerated electrochemical materials discovery - Journal of Materials Chemistry A (RSC Publishing) [https://pubs.rsc.org/en/content/articlelanding/2025/ta/d5ta00331h]
- 15. Expanding the frontiers of electrocatalysis: advanced theoretical methods for water splitting | Nano Convergence | Full Text [https://nanoconvergencejournal.springeropen.com/articles/10.1186/s40580-024-00467-w]
- 16. Foundation models for materials discovery – current state ... [https://www.nature.com/articles/s41524-025-01538-0]
- 17. Quantitative analysis of the electrochemical performance ... [https://www.sciencedirect.com/science/article/pii/S0021951722002846]
- 18. Comparison of Different Electrochemical Methodologies for ... [https://www.mdpi.com/2673-3293/5/1/4]
- 19. STEM Jobs See Uneven Progress in Increasing Gender, ... [https://www.pewresearch.org/social-trends/2021/04/01/stem-jobs-see-uneven-progress-in-increasing-gender-racial-and-ethnic-diversity/]
- 20. Materials science breakthroughs 2025: Trends to watch [https://www.cas.org/resources/cas-insights/materials-science-trends-2025]
- 21. Artificial intelligence-driven autonomous laboratory for ... [https://www.oaepublish.com/articles/cs.2025.66]
- 22. AI-Powered “Self-Driving” Labs: Accelerating Life Science ... [https://www.scispot.com/blog/ai-powered-self-driving-labs-accelerating-life-science-r-d]
- 23. High throughput computational and experimental methods for ... [https://pubs.rsc.org/en/content/articlehtml/2025/ta/d5ta00331h]
- 24. How automation has enabled AZ to develop their high ... [https://chronect.trajanscimed.com/news/how-automation-has-enabled-az-to-develop-their-high-throughput-experimentation-hte-mo-copy]
- 25. Development of the autonomous lab system to support ... [https://www.nature.com/articles/s41598-025-89069-y]
- 26. A Scoring Model for Catalyst Informatics Based on Real ... [https://www.mdpi.com/2073-4344/15/7/636]
- 27. Machine learning for catalysis: Bridging data-driven ... [https://www.sciencedirect.com/science/article/abs/pii/S2468519425005415]
- 28. Applications of density functional theory and machine ... [https://www.sciencedirect.com/science/article/pii/S2949822825002011]
- 29. DFT and hybrid classical–quantum machine learning ... [https://www.degruyterbrill.com/document/doi/10.1515/revce-2025-0022/html?srsltid=AfmBOoongKLCL0sA1jL53rpiz-cAlIDItIL7NUjsuRaKNu6CD4lw3XE3]
- 30. Machine learning for improved density functional theory ... [https://www.nature.com/articles/s41598-025-02088-7]
- 31. Automated platforms for electrocatalyst discovery [https://www.nature.com/articles/s44359-025-00113-6]
- 32. Artificial intelligence for catalyst design and synthesis [https://www.sciencedirect.com/science/article/abs/pii/S259023852500181X]
- 33. High-Throughput Screening Using Microfluidics [https://microfluidics.insightconferences.com/events-list/high-throughput-screening-using-microfluidics]
- 34. Compound Management for Quantitative High-Throughput ... [https://www.sciencedirect.com/science/article/pii/S1535553507003541]
- 35. A Guide to Flow Cytometry Markers [https://www.bdbiosciences.com/en-sg/learn/science-thought-leadership/blogs/flow-cytometry-markers]
- 36. Catalysis meets machine learning: a guide to data-driven ... [https://pubs.rsc.org/en/content/articlehtml/2025/cc/d5cc05274b?page=search]
- 37. Machine Learning Descriptors for Data‐Driven Catalysis Study [https://pmc.ncbi.nlm.nih.gov/articles/PMC10401178/]
- 38. Machine learning accelerated descriptor design for catalyst ... [https://www.nature.com/articles/s41524-025-01664-9]
- 39. Language models and protocol standardization guidelines ... [https://www.nature.com/articles/s41467-023-43836-5]
- 40. Electrocatalyst discovery through text mining and multi ... [https://arxiv.org/html/2502.20860v1]
- 41. Combinatorial high methodologies: the potentials in... throughput [https://bnrc.springeropen.com/articles/10.1186/s42269-024-01180-8]
- 42. Catalyst design, measurement guidelines, and device ... [https://www.sciencedirect.com/science/article/pii/S2666386422002739]
- 43. Accessing the High Throughput Screening Data Landscape [https://pmc.ncbi.nlm.nih.gov/articles/PMC5613246/]
- 44. High-Throughput Screening Assay Datasets from the ... [https://pmc.ncbi.nlm.nih.gov/articles/PMC5962024/]
- 45. Multi-Stage Graph Neural Networks for Data-Driven ... [https://arxiv.org/html/2509.06041v1]
- 46. High Throughput Screening - an overview [https://www.sciencedirect.com/topics/biochemistry-genetics-and-molecular-biology/high-throughput-screening]
- 47. Interference and Artifacts in High-content Screening - NCBI - NIH [https://www.ncbi.nlm.nih.gov/books/NBK615088/]
- 48. Systematic error detection in experimental high-throughput ... [https://pmc.ncbi.nlm.nih.gov/articles/PMC3034671/]
- 49. Impact of normalization methods on high-throughput ... [https://pmc.ncbi.nlm.nih.gov/articles/PMC4653387/]
- 50. Treating Cells as Reagents to Design Reproducible Assays [https://www.sciencedirect.com/science/article/pii/S2472555222067739]
- 51. Analysis of variability in high throughput screening data [https://pmc.ncbi.nlm.nih.gov/articles/PMC5438608/]
- 52. High-Throughput Screening Normalized to Biological ... [https://www.sciencedirect.com/science/article/pii/S2472555222073002]
- 53. Hit Identification and Optimization in Virtual Screening [https://pmc.ncbi.nlm.nih.gov/articles/PMC3772997/]
- 54. Quantitative high-throughput screening: A titration-based ... [https://pmc.ncbi.nlm.nih.gov/articles/PMC1518803/]
- 55. Data-driven normalization strategies for high-throughput ... [https://pmc.ncbi.nlm.nih.gov/articles/PMC2680405/]
- 56. Data Quality: The Hidden Catalyst in Early Drug Discovery [https://medium.com/data-quality-beyond/data-quality-the-hidden-catalyst-in-early-drug-discovery-3ffcd85ee329]
- 57. Machine learning application in thermal CO2 hydrogenation [https://www.sciencedirect.com/science/article/pii/S2772834X25000697]
- 58. AI is a viable alternative to high throughput screening [https://www.nature.com/articles/s41598-024-54655-z]
- 59. Automatic feature engineering for catalyst design using ... [https://www.nature.com/articles/s42004-023-01086-y]
- 60. Navigating the Hurdles: A Researcher's Guide to Optimizing ... [https://www.ranomics.com/navigating-the-hurdles-a-researchers-guide-to-optimizing-high-throughput-screens-library-design-and-protein-engineering]
- 61. Strategies for Improving Aptamer Screening : Efficiency ... Library [https://pubmed.ncbi.nlm.nih.gov/39378058/]
- 62. Changing the HTS Paradigm: AI-Driven Iterative Screening ... [https://www.sciencedirect.com/science/article/pii/S2472555222066692]
- 63. Machine Learning-Assisted Iterative Screening for Efficient ... [https://pubmed.ncbi.nlm.nih.gov/40658043/]
- 64. Iterative Approach of Experiment–Machine Learning for ... [https://pmc.ncbi.nlm.nih.gov/articles/PMC10666265/]
- 65. Model and Assay Validation and Acceptance - NCBI - NIH [https://www.ncbi.nlm.nih.gov/books/NBK424977/]
- 66. Fit-for-Purpose Assays vs. Validated Assays [https://www.socalbiosci.com/fit-for-purpose-assays-vs-validated-assays-whats-the-difference/]
- 67. Assay Validation in High Throughput Screening [https://www.intechopen.com/chapters/48130]
- 68. Fusing Docking Scoring Functions Improves the Virtual ... [https://pmc.ncbi.nlm.nih.gov/articles/PMC5725543/]
- 69. Protocol for an automated virtual screening pipeline ... [https://pubmed.ncbi.nlm.nih.gov/41206870/]
- 70. Hit Prioritization for High Throughput Screening with MVS-A [https://medium.com/@kapeluha.ann00/hit-prioritization-for-high-throughput-screening-with-mvs-a-d6750540b89f]
- 71. High-throughput approaches to catalyst discovery [https://pubmed.ncbi.nlm.nih.gov/12826132/]
- 72. Automation Revolutionizes High Throughput ... [https://chronect.trajanscimed.com/news/high-throughput-experimentation-hte]
- 73. Data Mining and Computational Modeling of High ... [https://pmc.ncbi.nlm.nih.gov/articles/PMC6181121/]
- 74. Ultra-high-throughput mapping of the chemical space ... [https://www.nature.com/articles/s41467-023-42446-5]
- 75. Facilitating harmonized data quality assessments. A data ... [https://bmcmedresmethodol.biomedcentral.com/articles/10.1186/s12874-021-01252-7]
- 76. HTS Assay Validation - NCBI [https://www.ncbi.nlm.nih.gov/books/NBK83783/]
- 77. Automated high-throughput activity and stability screening ... [https://www.sciencedirect.com/science/article/pii/S2667109322005115]
- 78. An efficient catalyst screening strategy combining machine ... [https://www.sciencedirect.com/science/article/abs/pii/S0301479725006413]