Mastering Catalyst Performance: A Comprehensive Guide to the Sabatier Principle in Pharmaceutical R&D
This article provides researchers, scientists, and drug development professionals with an in-depth exploration of the Sabatier Principle's critical role in modern catalyst design and optimization.
Mastering Catalyst Performance: A Comprehensive Guide to the Sabatier Principle in Pharmaceutical R&D
Abstract
This article provides researchers, scientists, and drug development professionals with an in-depth exploration of the Sabatier Principle's critical role in modern catalyst design and optimization. We first establish the fundamental theory, linking adsorption strength to catalytic activity. We then detail contemporary computational and experimental methodologies for applying the principle to accelerate catalyst discovery. Practical guidance for troubleshooting underperforming catalysts and interpreting complex activity plots is provided. Finally, we examine robust validation strategies and comparative frameworks for assessing catalysts in real-world reaction environments. This holistic guide synthesizes current knowledge to empower more efficient and predictive catalyst development for pharmaceutical synthesis and process chemistry.
Decoding the Sabatier Principle: The Bedrock of Modern Catalyst Design
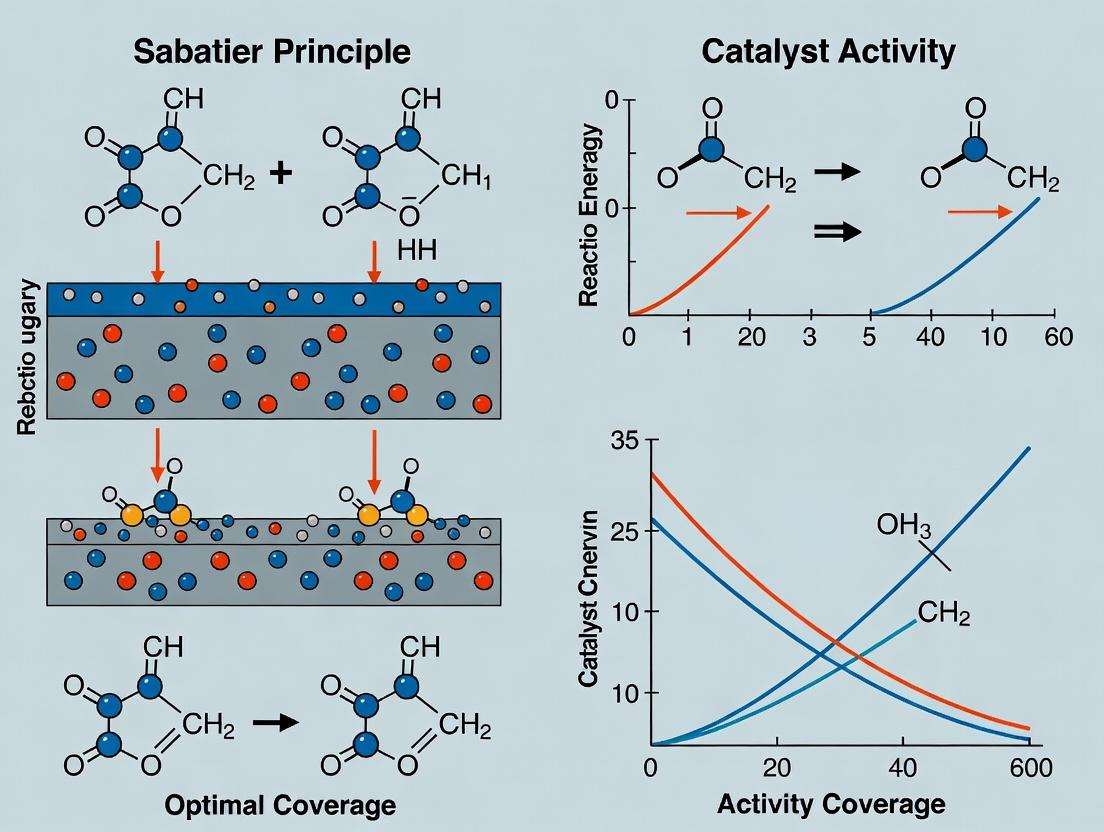
1. Introduction and Historical Context The Sabatier Principle, articulated by French chemist Paul Sabatier in the early 20th century, posits that optimal catalytic activity is achieved when the interaction between a catalyst surface and a reactant is of intermediate strength. A bond that is too weak leads to insufficient adsorption and activation; a bond that is too strong results in the product being unable to desorb, poisoning the catalytic site. This foundational concept forms the bedrock of modern heterogeneous catalysis and serves as a guiding paradigm for broader catalyst activity correlation research, extending into fields such as electrocatalysis, photocatalysis, and molecular drug design. The principle is graphically represented by a "volcano plot," where catalytic activity (e.g., turnover frequency) peaks at a moderate value of a suitable descriptor for adsorption strength.
2. Modern Quantitative Framework and Descriptors Contemporary research has formalized the Sabatier Principle using computational and experimental descriptors that correlate adsorption energy with catalytic activity. This enables the predictive design of catalysts.
Table 1: Common Descriptors for Adsorption Strength in Sabatier Analysis
| Descriptor | Typical Calculation/Measurement | Catalytic Reaction Example | Relation to Binding Strength |
|---|---|---|---|
| d-Band Center (εd) | Density functional theory (DFT) calculation of the average energy of the metal d-states relative to the Fermi level. | Ammonia synthesis, Oxygen Reduction Reaction (ORR). | Higher εd correlates with stronger adsorbate binding. |
| Adsorption Energy (ΔEads) | DFT-calculated energy difference between the adsorbed state and the separated adsorbate and surface. | Hydrogen Evolution Reaction (HER), CO2 Reduction. | Direct measure; more negative values indicate stronger binding. |
| Work Function (Φ) | Experimental measurement (e.g., Kelvin Probe) or DFT calculation of the energy needed to remove an electron. | Methanol oxidation, N2 reduction. | Higher Φ often correlates with weaker adsorbate binding for electron-donating species. |
| Scaling Relations | Linear correlations between the adsorption energies of different reaction intermediates (e.g., *COOH vs *CO). | CO2RR, OER. | Defines the limiting potential/activity volcano peak. |
3. Experimental Protocol: Generating a Volcano Plot for the Hydrogen Evolution Reaction (HER) This protocol details the methodology for establishing a classic Sabatier volcano plot for the HER (2H⁺ + 2e⁻ → H₂).
3.1. Aim: To correlate the experimentally measured HER activity of a series of transition metal electrodes with their theoretically calculated hydrogen adsorption energy (ΔEH*).
3.2. Materials and Reagents (The Scientist's Toolkit) Table 2: Key Research Reagent Solutions & Materials for HER Sabatier Analysis
| Item | Function / Specification |
|---|---|
| Polycrystalline Metal Electrodes | Working electrodes (e.g., Pt, Au, Ni, Cu, Mo, W). Provide varied adsorption strengths for H*. |
| Potentiostat/Galvanostat | Instrument for applying controlled potential/current and measuring electrochemical response. |
| H₂-saturated 0.1 M HClO₄ Electrolyte | Provides a constant proton source and non-adsorbing anions to minimize electrolyte interference. |
| Reversible Hydrogen Electrode (RHE) | Reference electrode whose potential is calibrated against the H⁺/H₂ equilibrium. |
| Rotating Disk Electrode (RDE) Setup | Ensches convective mass transport to isolate kinetic currents. |
| DFT Simulation Software (e.g., VASP, Quantum ESPRESSO) | For calculating the hydrogen adsorption energy (ΔEH*) on different metal (111) surfaces. |
3.3. Procedure:
- Electrode Preparation: Polish each metal electrode to a mirror finish. Clean ultrasonically in ultrapure water and ethanol.
- Electrochemical Cell Setup: Use a standard three-electrode cell (working metal electrode, Pt counter electrode, RHE reference) filled with deaerated, H₂-saturated 0.1 M HClO₄.
- Cyclic Voltammetry (CV): Record CVs in a non-Faradaic region to determine the electrochemically active surface area (ECSA) via hydrogen underpotential deposition (for Pt) or double-layer capacitance.
- Linear Sweep Voltammetry (LSV): Perform LSVs on the RDE (e.g., 1600 rpm) at a slow scan rate (e.g., 5 mV/s) to obtain steady-state polarization curves.
- Kinetic Current Extraction: Use the mass-transport correction (Koutecky-Levich equation) to extract the kinetic current (jk) from the LSV data at a fixed overpotential (e.g., η = 100 mV).
- Turnover Frequency (TOF) Calculation: Normalize jk by the number of active sites (from ECSA) to calculate the TOF.
- Computational ΔEH Determination: Using DFT, model a (111) slab for each metal. Calculate ΔEH = E(slab+H*) - E(slab) - ½E(H₂), where E denotes total energy. Correct for zero-point energy and solvation effects where necessary.
- Data Plotting: Plot the log(TOF) or exchange current density (j0) for each metal against its calculated ΔEH* to generate the volcano plot.
4. Conceptual Extensions and Current Frontiers The Sabatier framework has evolved beyond simple adsorption. Current research integrates it with:
- Microkinetic Modeling: Solving differential equations for surface coverage and turnover rates.
- Dynamic Conditions and Site Evolution: Accounting for catalyst restructuring under reaction conditions.
- Brønsted-Evans-Polanyi (BEP) Relations: Linking adsorption energies to activation barriers for elementary steps.
- Applications in Drug Discovery: Analogous "therapeutic windows" where optimal drug efficacy requires intermediate binding affinity to a target—too weak lacks potency, too strong leads to toxicity or poor pharmacokinetics.
5. Visualizing the Sabatier Principle and Workflow
Diagram 1: Sabatier Principle Conceptual Flow
Diagram 2: HER Volcano Plot Generation Workflow
The search for optimal catalysts—whether in heterogeneous catalysis, electrocatalysis, or drug discovery—is governed by a fundamental principle: the Sabatier principle. This principle posits that the interaction between a catalyst and a reactant must be "just right"; too weak, and no reaction occurs; too strong, and the product fails to desorb, poisoning the catalyst. The central thesis of modern catalyst and inhibitor design research is that this principle creates a predictable, quantifiable correlation between binding energy (or a related descriptor) and catalytic activity or drug efficacy. The Activity Volcano Plot is the definitive visual and analytical embodiment of this thesis, mapping this correlation to reveal the optimal "sweet spot" for maximum performance.
Theoretical Foundation: From Sabatier to Scaling Relations
The Sabatier principle was qualitative. Modern research has transformed it into a quantitative framework using scaling relations and the Bronsted-Evans-Polanyi (BEP) principle. Scaling relations reveal that the binding energies of different intermediates on a catalyst surface are often linearly correlated. The BEP principle states that the activation energy for a reaction step is linearly correlated with the reaction enthalpy of that step. These two relationships combine to dictate that for a given catalytic reaction, the overall activity as a function of a key intermediate's adsorption energy will trace a volcano-shaped curve.
- Left Leg (Strong Binding): Activity is limited by product desorption. The activity increases as binding weakens.
- Peak (Optimal Binding): The "sweet spot" where the activation barriers for both the reaction and desorption steps are balanced.
- Right Leg (Weak Binding): Activity is limited by the initial reaction or activation step. The activity increases as binding strengthens.
Constructing an Activity Volcano Plot: Core Methodology
Data Acquisition Protocol
Objective: To obtain catalytic activity (e.g., turnover frequency - TOF) and descriptor data (e.g., adsorption energy ΔE) for a series of related catalysts or compounds.
Protocol:
- Catalyst/Compound Library Selection: Define a homologous series (e.g., transition metal surfaces, doped graphene, a series of enzyme inhibitors).
- Descriptor Calculation (Computational):
- Perform Density Functional Theory (DFT) geometry optimization for the catalyst/compound model with the key adsorbed intermediate (e.g., *COOH for CO₂ reduction, a substrate analog for an enzyme).
- Calculate the adsorption/binding energy: ΔE_ads = E(total system) - E(catalyst) - E(adsorbate in gas phase).
- Ensure consistent computational parameters (functional, basis set, k-point grid, solvent model) across all systems.
- Activity Measurement (Experimental):
- For catalysts: Use a standardized reactor setup (e.g., fixed-bed, electrochemical cell) under identical conditions (T, P, potential, flow rate).
- Measure intrinsic activity as Turnover Frequency (TOF in s⁻¹) or exchange current density (j₀ for electrochemistry).
- For enzyme inhibitors: Use a fluorescence-based or calorimetric assay to determine half-maximal inhibitory concentration (IC₅₀) or inhibition constant (Kᵢ). Convert to activity metric (e.g., pIC₅₀ = -log₁₀(IC₅₀)).
Plot Generation and Analysis
- Data Pairing: Create a dataset where each catalyst/compound has an (X, Y) coordinate: X = Descriptor (e.g., ΔE_ads), Y = log₁₀(Activity) (e.g., log(TOF)).
- Plotting: Scatter plot of Y vs. X.
- Volcano Fitting: The data is fit with a theoretical microkinetic model or a two-branch function (e.g., a combination of two linear or Sabatier-type equations). The peak defines the optimal descriptor value.
Table 1: Exemplar Volcano Plot Data for the Hydrogen Evolution Reaction (HER) on Transition Metals
| Metal Catalyst | ΔE_H* (eV) [Descriptor] | Exchange Current Density, log( | j₀ | ) (A/cm²) [Activity] | Position on Volcano |
|---|---|---|---|---|---|
| Pt | -0.27 | -3.0 | Near Peak | ||
| Ir | -0.12 | -3.2 | Near Peak | ||
| Ni | -0.30 | -5.1 | Left Leg | ||
| Co | -0.35 | -5.5 | Left Leg | ||
| W | +0.24 | -6.8 | Right Leg | ||
| Au | +0.50 | -8.0 | Right Leg | ||
| Theoretical Optimum | ~0 eV | Max(log|j₀|) | Peak |
ΔE_H: Gibbs free energy of hydrogen adsorption. Data is illustrative, based on established literature trends (Nørskov et al., J. Phys. Chem. B, 2004).
Table 2: Key Parameters for Volcano Plot Interpretation
| Parameter | Symbol | Typical Unit | Interpretation |
|---|---|---|---|
| Optimal Descriptor Value | X_opt | eV, kcal/mol | The "sweet spot" binding energy for maximum activity. |
| Volcano Peak Height | Y_max | log(TOF), log|j₀| | The theoretical maximum achievable activity for the reaction. |
| Volcano Branch Slope | mleft, mright | Activity unit/eV | Sensitivity of activity to changes in binding strength on each leg. |
| Activity Span | ΔY | log(TOF) | The range in activity from the worst to the best catalyst. |
Logical Framework and Workflow Diagram
Diagram Title: Workflow for Constructing an Activity Volcano Plot
Diagram Title: Theoretical Foundations of the Volcano Plot
The Scientist's Toolkit: Research Reagent Solutions
Table 3: Essential Materials and Tools for Volcano Plot Research
| Item / Reagent | Function / Purpose | Example (Non-branded) |
|---|---|---|
| DFT Software Suite | For calculating adsorption energies and electronic structure of catalyst models. | Plane-wave basis set code with GGA-PBE functional. |
| High-Throughput Screening Reactor | For standardized, parallel activity testing of catalyst libraries. | 16-channel parallel fixed-bed microreactor with GC detection. |
| Electrochemical Workstation | For measuring electrocatalytic activity (j₀, TOF) under controlled potential. | Potentiostat with rotating disk electrode (RDE) setup. |
| Enzyme Activity Assay Kit | For measuring inhibitor potency (IC₅₀, Kᵢ) in drug discovery. | Fluorogenic substrate-based continuous assay for target protease. |
| Reference Electrode & Electrolyte | Essential for reproducible electrochemical measurements vs. a standard potential. | Saturated calomel electrode (SCE) in 0.1 M HClO₄ electrolyte. |
| Calibration Gas Mixtures | For accurate quantification of reaction products in catalytic testing. | 1% CO₂ in H₂, balanced with Ar for methanation studies. |
| Computational Catalyst Model | Standardized slab or cluster model for consistent DFT calculations. | (4x4) 3-layer metal slab with 15 Å vacuum, 3x3x1 k-points. |
Within the broader thesis on the Sabatier principle and catalyst activity correlation, this document provides a microscopic, energetic foundation. The Sabatier principle posits an optimal, intermediate binding strength for a catalyst to maximize the rate of a catalytic reaction. This guide delves into the quantitative, microscopic basis of this principle: the explicit adsorption and desorption energies of reacting intermediates. These energies govern the surface coverages and the kinetic barriers for elementary steps, directly determining the catalytic turnover frequency (TOF). The correlation between macroscopic activity and these microscopic parameters is the core of modern catalyst design, with direct analogies in enzyme kinetics and drug-receptor interactions relevant to pharmaceutical development.
Fundamental Energy Relationships and the Sabatier Volcano
The activity of a heterogeneous catalyst for a given reaction (e.g., A + B → C) is dictated by the potential energy surface of the reaction pathway. The adsorption energies of key intermediates (e.g., *A, *B, *C, *A-B) are often linearly correlated due to scaling relations, reducing the multi-dimensional design space to one or two descriptor variables. The Sabatier optimum emerges where the trade-off between the ability to activate a reactant (requiring strong binding) and the ability to desorb the product (requiring weak binding) is balanced.
Table 1: Representative Adsorption Energy Correlations for Key Catalytic Reactions
| Reaction (Example) | Key Intermediate Descriptor | Typical Optimal ΔE_ads (eV) Range | Reference Model Surface |
|---|---|---|---|
| Hydrogen Evolution (HER) | ΔG_H* | ~0 eV (thermoneutral) | Pt(111) |
| Oxygen Reduction (ORR) | ΔGO* - ΔGOH* | ~0.2-0.3 eV | Pt3Ni(111) |
| Ammonia Synthesis (N₂ + 3H₂ → 2NH₃) | ΔE_N* | ~ -0.8 eV | Ru B5 Sites |
| Methanation (CO + 3H₂ → CH₄ + H₂O) | ΔEC* or ΔECO* | ~ -0.6 eV (C*) | Co(0001) |
| Propane Dehydrogenation (C₃H₈ → C₃H₆ + H₂) | ΔE_C₃H₇* | ~ -1.2 to -1.5 eV | Pt(111) |
Experimental Protocols for Energy Determination
Temperature-Programmed Desorption (TPD) for Adsorption Energy
Objective: To quantitatively measure the desorption energy (Edes) of an adsorbate, which is approximately the negative of its adsorption energy (Eads) for physisorption and simple chemisorption.
Detailed Protocol:
- Surface Preparation: A single-crystal catalyst sample is cleaned in an ultra-high vacuum (UHV) chamber via cycles of Ar⁺ sputtering (1-2 keV, 15 min) and annealing (e.g., 800 K for metals, 5 min).
- Adsorbate Dosing: The clean surface is exposed to a precise dose of the reactant gas (e.g., CO, H₂) via a calibrated molecular beam or leak valve at a low sample temperature (e.g., 100 K).
- Linear Temperature Ramp: The sample temperature is increased linearly (β = dT/dt, typically 1-10 K/s) while the chamber pressure is monitored by a mass spectrometer.
- Data Analysis: The desorption rate (-dθ/dT) is plotted versus temperature. For a simple first-order desorption, the Polanyi-Wigner equation is used: -dθ/dT = (ν/β) θⁿ exp(-Edes/RT). The peak temperature (Tp) is related to Edes. Edes is extracted via analysis of T_p shifts with coverage (θ) and heating rate (β).
Microcalorimetry for Differential Heat of Adsorption
Objective: To measure the heat released upon gas adsorption directly, providing the integral and differential adsorption energies as a function of surface coverage.
Detailed Protocol:
- Sample Activation: A high-surface-area powder catalyst (e.g., 100 mg) is loaded into a calorimetry cell and activated in situ (e.g., reduction in H₂ at elevated temperature).
- Calorimeter Calibration: The heat-flow sensor is calibrated using a known resistive heater pulse.
- Incremental Dosing: Small, precise doses of the probe gas (e.g., CO, NH₃) are introduced to the sample at a constant temperature (e.g., 303 K). The amount adsorbed and the concomitant heat pulse are measured simultaneously.
- Energy Calculation: The differential heat of adsorption is calculated as qdiff = Qpulse / Δnads. Plotting qdiff versus coverage reveals the heterogeneity of adsorption sites and the strength of adsorbate-adsorbate interactions.
Microscopic Pathway to Turnover: A Kinetic Diagram
Title: Microscopic Energetic Pathway Governing Catalytic Turnover
The Scientist's Toolkit: Key Research Reagent Solutions
Table 2: Essential Materials and Reagents for Adsorption/Desorption Studies
| Item | Function/Description | Typical Example/Supplier |
|---|---|---|
| Single-Crystal Surfaces | Well-defined model catalysts for fundamental UHV studies. | MaTeck GmbH (e.g., Pt(111), Ru(0001) disks, 10mm dia). |
| High-Purity Calibration Gases | Precise dosing and calibration for TPD and calorimetry. | Air Liquide AlphaGaz mixtures (e.g., 1% CO/He, 5% H₂/Ar). |
| UHV Gas Dosing System | For controlled, leak-free introduction of gases in UHV. | Specs GmbH EQP/QSG series mass spectrometer with dosing valve. |
| Calorimetry Reference Material | For calibration of microcalorimeter heat sensors. | Benzolic acid (NIST SRM 39j) or sapphire (for heat capacity). |
| Temperature Controller/Programmer | Provides precise linear temperature ramps for TPD. | Oxford Instruments Intelligent Temperature Controller ITC 503. |
| High-Surface-Area Catalyst Powders | For calorimetry and realistic catalyst testing. | Sigma-Aldrich (e.g., 5% Pt/Al₂O³, SiO₂-supported metals). |
| Density Functional Theory (DFT) Code | Computational calculation of adsorption energies. | VASP, Quantum ESPRESSO, CP2K. |
| Catalyst Database | Repository of experimental & computed adsorption energies. | The CatApp database (Nørskov group, DTU). |
Integrating Microscopic Energies into Activity Predictions
The final step is linking the measured/computed energies to the turnover frequency (TOF). Using mean-field microkinetic modeling, the rate of each elementary step is expressed as a function of its activation barrier (derived from adsorption energies via Bronsted-Evans-Polanyi relations) and the coverage of intermediates. Solving the steady-state equations yields the TOF.
Table 3: Microkinetic Model Parameters for a Generic A → B Reaction
| Elementary Step | Rate Expression (r) | Activation Energy (E_a) Relation | Notes |
|---|---|---|---|
| Adsorption: A + * → A* | rads = kads PA θ* | E_a,ads ≈ 0 | Sticking coefficient included in k_ads. |
| Surface Reaction: A* → B* | rrxn = krxn θ_A* | Ea,rxn = E0 + β ΔE_A* | β is the Brønsted coefficient (~0.5). |
| Desorption: B* → B + * | rdes = kdes θ_B* | Ea,des = Edes,0 - α ΔE_B* | E_des is directly from TPD. |
The solution of this model produces the classic "volcano" plot when TOF is plotted versus the descriptor adsorption energy (e.g., ΔE_A*), quantitatively validating the Sabatier principle at the microscopic level. This framework is indispensable for the rational design of catalysts and, by extension, for understanding molecular recognition and binding energetics in drug development.
The Sabatier principle, originally formulated for heterogeneous metal catalysts, posits that optimal catalytic activity arises from an intermediate strength of interaction between the catalyst and the reactant. A bond that is too weak fails to activate the substrate, while one that is too strong leads to product inhibition. This foundational concept provides a predictive "volcano plot" relationship between a descriptor of binding energy and catalytic activity.
This whitepaper explores the extension of this principle beyond simple metal surfaces to the complex landscapes of biological enzymes and synthetic organocatalysts. In these systems, the principle evolves from a simple adsorption energy descriptor to a multidimensional optimization of multiple interactions, conformational dynamics, and microenvironmental effects within a binding pocket or catalytic site. The core thesis is that the Sabatier principle remains a unifying conceptual framework, but its quantitative application requires sophisticated, system-specific descriptors that account for complexity.
Quantitative Data Synthesis: Descriptors and Activities Across Catalyst Classes
The following tables summarize key quantitative descriptors and their correlation with activity for different catalyst classes, as established in recent literature.
Table 1: Descriptor-Activity Correlations in Heterogeneous Metal Catalysis (Classic Sabatier)
| Reaction | Primary Descriptor | Optimal Value/ Range | Peak TOF (s⁻¹) | Catalyst at Peak | Reference Year |
|---|---|---|---|---|---|
| Hydrogen Evolution Reaction (HER) | H* Adsorption Free Energy (ΔG_H*) | ~0 eV | 10-100 (at η=0) | Pt, Pt-alloys | 2023 |
| Oxygen Reduction Reaction (ORR) | O* or OH* Adsorption Energy | ΔE_O* ~ 0.2 eV weaker than Pt | 0.02-0.05 (per site) | Pt₃Ni(111) surface | 2022 |
| Ammonia Synthesis (N₂ + H₂ → NH₃) | N₂ Dissociation Barrier / N* Binding Energy | Intermediate N* binding | 10⁻¹ - 10¹ | Ru-based alloys | 2023 |
Table 2: Extended Descriptors for Enzymatic Catalysis
| Enzyme Class / Reaction | Extended Sabatier Descriptor(s) | Experimental/Kinetic Readout | Impact on Activity (kcat/KM) | Reference Year |
|---|---|---|---|---|
| Cytochrome P450 (C-H oxidation) | Fe-O Bond Strength / Proton-Coupled Electron Transfer Barrier | Computed Reaction Barrier (eV); Kinetic Isotope Effect | Optimized barrier ~0.7 eV | 2024 |
| Serine Protease (e.g., Trypsin) | Oxyanion Hole H-bond Strength / Charge Stabilization | Substrate specificity constant | Too strong/weak destabilizes tetrahedral intermediate | 2023 |
| [FeFe]-Hydrogenase (H₂ production) | µ-CO Ligand Stretching Frequency (IR) / Fe-H Bond Energy | Catalytic rate, Overpotential | ν(CO) correlates with hydride affinity and activity | 2023 |
Table 3: Descriptors in Asymmetric Organocatalysis
| Organocatalyst / Reaction | Molecular Descriptor | Correlation with Outcome | Optimal Range/Value | Reference Year |
|---|---|---|---|---|
| Proline-derived Aminocatalysts (Aldol) | pKa of conjugate acid / NBO charge on nucleophilic N | Enantiomeric excess (ee%), Yield | pKa ~10-12 for balanced iminium/enamine stability | 2024 |
| Chiral Phosphoric Acids (Transfer Hydrogenation) | Calculated Confinement Size / Steric Maps | Reaction rate, ee% | Defined by substituent's percent buried volume (%V_bur) | 2023 |
| N-Heterocyclic Carbenes (Breslow intermediate formation) | NMR Chemical Shift (¹³C carbene) / LUMO energy of precursor | Turnover frequency for benzoin condensation | δ(¹³C) ~ 210-220 ppm | 2023 |
Experimental Protocols for Key Studies
Protocol 3.1: Measuring Sabatier-Type Volcano Plots for HER on Bimetallic Surfaces
Objective: To experimentally determine the hydrogen adsorption free energy (ΔG_H) and correlate it with activity for a series of bimetallic electrodes. Materials: *See "The Scientist's Toolkit" Section 5. Method:
- Electrode Fabrication: Prepare a series of polycrystalline bimetallic thin films (e.g., PtX, PdY, where X/Y are transition metals) via physical vapor deposition on polished glassy carbon substrates. Characterize composition via XPS and surface structure via cyclic voltammetry in inert electrolyte.
- ΔGH* Determination (Experimental):
- Use a standard three-electrode electrochemical cell (H₂-saturated 0.1 M HClO₄).
- Perform underpotential deposition (UPD) of a Cu monolayer in a separate Cu²⁺-containing solution to determine active surface area.
- Acquire hydrogen adsorption/desorption peaks via cyclic voltammetry at slow scan rates (10-50 mV/s).
- Calculate ΔGH* from the potential of the adsorption/desorption peak center relative to the reversible hydrogen electrode (RHE), using the relation derived from the Langmuir isotherm for weak-overlap approximation.
- Activity Measurement:
- In the same cell, perform linear sweep voltammetry for HER in the kinetically controlled region (low overpotential, e.g., η = -0.05 to -0.10 V vs. RHE).
- Extract the exchange current density (j₀) by fitting the linear region of the Tafel plot (η vs. log |j|).
- Normalize j₀ by the electrochemically active surface area (ECSA) to obtain a turnover frequency (TOF) surrogate.
- Data Analysis: Plot TOF (or log j₀) vs. the experimentally determined ΔG_H*. A classic volcano relationship should emerge, with Pt near the peak.
Protocol 3.2: Probing Sabatier-like Optimization in Enzyme Engineering (Directed Evolution)
Objective: To evolve a cytochrome P450 enzyme for improved activity on a non-native substrate, monitoring changes in key mechanistic descriptors. Materials: See "The Scientist's Toolkit" Section 5. Method:
- Library Creation: Generate a mutant library of a target P450 (e.g., P450BM3) via error-prone PCR or site-saturation mutagenesis focused on the substrate access channel and active site.
- High-Throughput Screening: Use a fluorescent or colorimetric assay linked to product formation (e.g., conversion of a non-fluorescent substrate to a fluorescent product). Screen thousands of clones in microtiter plates.
- Kinetic Characterization of Hits: Purify wild-type and improved variant enzymes. Determine steady-state kinetic parameters (kcat, KM) for the target reaction.
- Computational Descriptor Calculation:
- Perform molecular dynamics (MD) simulations of substrate bound in the active site of wild-type and variant enzymes.
- From representative snapshots, perform quantum mechanics/molecular mechanics (QM/MM) calculations to determine the transition state energy for the rate-limiting C-H abstraction step.
- Compute the spin density on the reactive oxo-iron species and the bond dissociation energy (BDE) of the target C-H bond as perturbed by the enzyme environment.
- Correlation Analysis: Plot enzyme activity (log(kcat/KM)) against the computed reaction barrier or another electronic descriptor (e.g., Fe-O vibrational frequency from simulated IR). The trend should show an optimal, intermediate barrier height, reflecting an extended Sabatier balance.
Protocol 3.3: Establishing a Steric-Electronic Map for Chiral Organocatalysts
Objective: To quantitatively link steric and electronic descriptors of a chiral phosphoric acid (CPA) catalyst to its performance in an asymmetric transfer hydrogenation. Materials: See "The Scientist's Toolkit" Section 5. Method:
- Catalyst Synthesis & Characterization: Synthesize or acquire a diverse library of CPAs with systematic variation in 3,3'-substituents (e.g., from mesityl to phenyl to naphthyl).
- Steric Descriptor Calculation:
- Optimize the ground-state geometry of each CPA using Density Functional Theory (DFT) (e.g., B3LYP/6-31G* level).
- Calculate the percent buried volume (%V_bur) of the substituent around the P=O oxygen (the key binding site) using a standard sphere radius (e.g., 3.5 Å).
- Electronic Descriptor Calculation:
- From the optimized structure, compute the natural population analysis (NPA) charge on the acidic proton or the molecular electrostatic potential (MESP) at the catalytic site.
- Calculate the energy of the lowest unoccupied molecular orbital (E_LUMO) of the conjugate base.
- Catalytic Testing:
- Perform the asymmetric reduction of a model imine (e.g., 2-phenylquinoline) with Hantzsch ester as the hydride source, using each CPA (e.g., 5 mol%) under standardized conditions (solvent, temperature, concentration).
- Measure conversion (via ¹H NMR or GC) and enantiomeric excess (via chiral HPLC) after a fixed reaction time.
- Multi-Dimensional Analysis: Create a 3D plot with axes for %Vbur (steric), ELUMO or NPA charge (electronic), and catalytic performance (ee% or log(initial rate)). The data will map an "activity region" in descriptor space, illustrating the modern Sabatier optimum in a multi-parameter landscape.
Visualizations: Pathways and Workflows
(Fig 1: Sabatier principle across catalysts)
(Fig 2: Experimental workflow for HER volcano plot)
(Fig 3: Enzyme catalysis C-H activation pathway)
The Scientist's Toolkit: Essential Research Reagents & Materials
| Category | Item/Reagent | Primary Function in Research |
|---|---|---|
| Electrochemical Catalysis | Glassy Carbon Rotating Disk Electrode (RDE) | Provides a reproducible, well-defined hydrodynamic electrode surface for kinetic studies under controlled mass transport. |
| 0.1 M Perchloric Acid (HClO₄) Ultra-Pure Electrolyte | Standard non-adsorbing, high-purity acidic electrolyte for fundamental studies of metal catalyst activity (e.g., HER, ORR). | |
| Reversible Hydrogen Electrode (RHE) | The essential reference electrode for all aqueous electrocatalysis, as its potential is pH-independent. | |
| Enzyme Engineering | KOD or Taq DNA Polymerase for Error-Prone PCR | Used to introduce random mutations into a gene of interest to create genetic diversity for directed evolution. |
| Fluorescent or Chromogenic Substrate Assay Kit | Enables high-throughput screening of enzyme variant libraries by linking catalytic turnover to an optical signal. | |
| Ni-NTA Agarose Resin | For the rapid purification of polyhistidine-tagged recombinant enzyme variants via immobilized metal affinity chromatography (IMAC). | |
| Computational & Organocatalysis | Gaussian, ORCA, or similar DFT Software | Performs quantum chemical calculations to determine electronic structure, transition states, and molecular descriptors (ELUMO, NPA, %Vbur). |
| Chiral Stationary Phase HPLC Columns (e.g., Chiralpak IA/IB/IC) | Critical for the accurate measurement of enantiomeric excess (ee%) in reactions with organocatalysts. | |
| Deuterated Solvents (CDCl₃, DMSO-d₆) | For reaction monitoring and yield determination by quantitative ¹H NMR spectroscopy. | |
| General Characterization | X-ray Photoelectron Spectrometer (XPS) | Provides surface-sensitive elemental composition and oxidation state analysis of heterogeneous catalysts. |
| Isothermal Titration Calorimeter (ITC) | Measures binding affinities (K_d) and thermodynamics (ΔH, ΔS) of substrate-catalyst interactions in solution. |
Within the framework of Sabatier principle and catalyst activity correlation research, the quest for optimal catalytic performance has evolved beyond a simple volcano-curve paradigm. The Sabatier principle posits an optimal intermediate binding energy for reactants and products, but its classical interpretation often oversimplifies complex, multi-step reactions on real surfaces. Modern computational and experimental studies reveal that adsorption energies of different intermediates are often linearly correlated—a phenomenon known as scaling relations. These scaling relations impose fundamental constraints on catalytic activity, as they couple the binding strengths of various adsorbates, making it impossible to independently optimize the energy of all transition states and intermediates. Consequently, the Bronsted-Evans-Polanyi (BEP) principle, which establishes a linear relationship between activation energies and reaction enthalpies for families of similar reactions, interacts intimately with these scaling relations. This interplay dictates the shape and apex of catalytic activity volcanoes, determining the theoretical limits of catalyst performance. This whitepaper provides an in-depth technical examination of these concepts, their modern reinterpretations, and the methodologies driving this frontier of research critical to catalyst and drug development.
Foundational Principles: A Technical Primer
The Sabatier Principle and the Activity Volcano
The Sabatier principle states that the ideal catalyst binds reactants strongly enough to facilitate reaction, but not so strongly that products are immobilized. Plotting activity (e.g., turnover frequency) versus a descriptor (e.g., adsorption energy of a key intermediate) typically yields a volcano-shaped curve. The peak represents the optimal descriptor value.
Scaling Relations
In heterogeneous catalysis, the adsorption energies (ΔE_ads) of different adsorbates (e.g., *CH, *CH₂, *OH, *OOH) on various metal surfaces are often linearly correlated. For instance, the adsorption energy of *OOH scales with that of *OH:
ΔE_*OOH ≈ a * ΔE_*OH + b
where a is the scaling coefficient (often near 1) and b is a constant. These relations arise from similar bonding mechanisms across different surfaces. They limit the degrees of freedom for catalyst optimization.
Bronsted-Evans-Polanyi (BEP) Principles
The BEP principle posits a linear relationship between the activation barrier (E_a) and the reaction enthalpy (ΔH) for a given family of elementary steps:
E_a ≈ α * ΔH + E₀
Here, α is the transfer coefficient (0 < α < 1), and E₀ is a constant. This implies that more exothermic steps have lower barriers.
The Interplay: Constraining the Volcano
Scaling relations tie together the enthalpies (ΔH) of different steps via the adsorption energies of intermediates. The BEP relations then translate these enthalpy constraints into activation barriers. This combined effect determines the overall activity volcano. The theoretical maximum activity is thus not a free parameter but is constrained by these coupled linear relationships, defining the "top of the volcano" for a given class of materials and reactions.
Quantitative Data and Scaling Relation Tables
Table 1: Exemplary Scaling Relations for Oxygen Reduction Reaction (ORR) Intermediates on Transition Metal Surfaces Data derived from DFT studies on close-packed (111) surfaces.
| Adsorbate Pair (Y vs. X) | Scaling Coefficient (a) | Constant (b) [eV] | R² | Typical Descriptor (X) |
|---|---|---|---|---|
| *OOH vs. *OH | 1.00 ± 0.03 | 3.20 ± 0.15 | >0.99 | ΔE_*OH |
| *O vs. *OH | 0.50 ± 0.05 | 0.10 ± 0.25 | >0.95 | ΔE_*OH |
| *OH vs. *H₂O | ~0.00 | 0.40 ± 0.10 | - | ΔE_*H₂O |
Table 2: BEP Parameters for Key Catalytic Reaction Families Compiled from recent microkinetic modeling studies.
| Reaction Family | Elementary Step Example | Transfer Coefficient (α) | Constant (E₀) [eV] | Descriptor Used |
|---|---|---|---|---|
| Dehydrogenation | *C₂H₆ → *C₂H₅ + *H | 0.75 - 0.90 | 1.0 - 1.5 | ΔE*C₂H₅ - ΔE*C₂H₆ |
| C-O Bond Scission | *COH → *CO + *H | 0.60 - 0.80 | 0.8 - 1.2 | ΔE*COH - ΔE*CO |
| O/OH Hydrogenation | *O + *H → *OH | 0.20 - 0.40 | 0.5 - 0.8 | ΔE*O - ΔE*OH |
Experimental and Computational Protocols
Protocol for Establishing Scaling Relations via DFT
- System Selection: Choose a set of representative catalyst models (e.g., 10-15 transition metal (111) surfaces, including doped or strained variants).
- DFT Calculation Parameters:
- Use a plane-wave basis set with PAW or USP pseudopotentials (e.g., in VASP or Quantum ESPRESSO).
- Employ the RPBE or BEEF-vdW functional to account for van der Waals interactions.
- Set energy cutoff ≥ 400 eV, k-point mesh of at least (4x4x1) for slab models.
- Optimize all geometries until forces are < 0.03 eV/Å.
- Adsorption Energy Calculation:
- For each adsorbate (A) on surface (*), calculate:
ΔE_ads = E_(slab+A) - E_slab - E_(A,gas). - Ensure consistent slab size (≥ 3 layers), vacuum (≥ 15 Å), and fix bottom layers.
- For each adsorbate (A) on surface (*), calculate:
- Linear Regression Analysis:
- Plot ΔEads of adsorbate Y against ΔEads of adsorbate X for all surfaces.
- Perform linear least-squares fitting to obtain coefficients
a,b, and R².
Protocol for Microkinetic Modeling Integrating BEP/Scaling
- Reaction Network Definition: Map all plausible elementary steps for the target reaction (e.g., CO₂ reduction to CH₄).
- Descriptor-Based Energetics: Use established scaling relations to calculate all adsorption energies from 1-2 key descriptors (e.g., ΔE*C, ΔE*O). Apply BEP relations to estimate activation barriers for all steps.
- Microkinetic Solver Setup:
- Write rate equations for each surface species using mean-field approximation.
- Set operating conditions (T, P, gas-phase partial pressures).
- Solve the coupled differential-algebraic system for steady-state coverages and turnover frequencies (TOFs) using software like CatMAP or in-house Python/Matlab code.
- Volcano Plot Construction: Vary the descriptor value(s) across a physically meaningful range, recalculate all energies via scaling/BEP, compute the TOF at each point, and plot TOF vs. descriptor.
Visualizing the Conceptual and Experimental Framework
Diagram 1: The Interplay of Descriptors, Scaling, and BEP in Catalyst Modeling.
Diagram 2: Computational Workflow for Determining Scaling Relations.
The Scientist's Toolkit: Key Research Reagent Solutions
Table 3: Essential Materials and Tools for Scaling/BEP Research
| Item Name/Category | Function & Explanation |
|---|---|
| VASP (Vienna Ab initio Simulation Package) | Industry-standard DFT software for calculating electronic structures, adsorption energies, and transition states on solid surfaces. |
| RPBE / BEEF-vdW Density Functionals | Exchange-correlation functionals that provide improved accuracy for adsorption energies and reaction barriers on metals and oxides. |
| CatMAP (Catalysis Microkinetic Analysis Package) | Python-based software for constructing descriptor-based microkinetic models, automating the generation of activity volcanoes from scaling/BEP inputs. |
| Quantum ESPRESSO | Open-source DFT suite for electronic structure calculations, valuable for benchmarking and method development. |
| Pymatgen & ASE (Atomic Simulation Environment) | Python libraries for manipulating crystal structures, setting up calculations, and analyzing DFT outputs (e.g., extracting adsorption energies). |
| High-Throughput Computation Databases (NOMAD, Materials Project) | Repositories of pre-computed DFT data for thousands of materials, used for initial screening and validation of hypothesized scaling relations. |
| Single-Crystal Alloy Catalysts | Well-defined experimental model systems (e.g., Pt₃M(111) alloys) for validating predicted scaling relations via calibrated surface science techniques. |
| Modified Sabatier Analysis Kit | A conceptual framework integrating scaling/BEP constraints to design "beyond the volcano" strategies, such as breaking scaling relations via site isolation or dynamic catalysis. |
From Theory to Bench: Applying Sabatier Analysis in Drug Development
Within the paradigm of catalyst activity correlation research, the Sabatier principle provides the foundational thesis: optimal catalytic activity occurs at an intermediate binding energy of key reaction intermediates. Computational screening via Density Functional Theory (DFT) has emerged as the indispensable tool for quantifying these adsorption energies and predicting activity trends a priori. This guide details the technical protocols for conducting such screenings, enabling the rational design of catalysts and bioactive molecules by mapping the adsorbate-catalyst binding landscape.
Foundational DFT Theory and Descriptors for Adsorption
DFT approximates the many-body Schrödinger equation by using functionals of the electron density. For adsorption studies, the calculation of the adsorption energy (ΔEads) is central:
ΔEads = E(surface + adsorbate) - E(surface) - E(adsorbate in gas phase)
Where E is the total energy from the DFT calculation. A negative ΔEads indicates exothermic adsorption.
Key activity descriptors derived from DFT include:
- d-band center (εd): For transition metal surfaces, the position of the d-band relative to the Fermi level correlates with adsorption strength.
- Generalized Coordination Number (GCN): A refined metric that accounts for the local environment of a surface atom.
- Projected Density of States (pDOS): Reveals the electronic interaction between adsorbate orbitals and catalyst surface states.
Table 1: Common DFT-Derived Descriptors for Adsorption Trends
| Descriptor | Definition (Formula/Concept) | Correlation with Adsorption Strength | Typical Calculation Method |
|---|---|---|---|
| Adsorption Energy (ΔEads) | ΔEads = Esystem - Eslab - Eadsorbate | Direct measure; more negative = stronger binding | Energy difference from relaxed calculations. |
| d-band Center (εd) | ( \epsilond = \frac{\int{-\infty}^{EF} E \cdot \rhod(E) dE}{\int{-\infty}^{EF} \rho_d(E) dE} ) | Higher εd (closer to EF) = stronger binding | Projected DOS analysis of surface metal d-orbitals. |
| Generalized Coord. No. (GCN) | ( \overline{CN} = \sum{j} \frac{CNj}{CN_{max,j}} ) | Higher GCN typically = stronger binding (on metals) | Analysis of nearest neighbors in the surface structure. |
Detailed Experimental Protocol: A Standard DFT Workflow for Adsorption Energy Calculation
This protocol outlines the steps for calculating the adsorption energy of a simple diatomic molecule (e.g., CO) on a transition metal surface (e.g., fcc(111)).
Step 1: Surface Slab Model Construction
- Bulk Optimization: Obtain the experimental or optimized lattice constant for the metal (e.g., Pt) by performing a bulk geometry optimization.
- Slab Creation: Cleave the bulk crystal along the desired Miller indices (e.g., (111)) to create a slab. A typical thickness is 3-5 atomic layers.
- Supercell and Vacuum: Build a surface supercell (e.g., (2x2) or (3x3)) to minimize adsorbate-adsorbate interactions. Add a vacuum layer of at least 15 Å in the z-direction to decouple periodic images.
Step 2: Computational Parameter Selection
- Exchange-Correlation Functional: Select an appropriate functional. The RPBE functional is often recommended for adsorption as it corrects the over-binding tendency of PBE.
- Pseudopotentials/PAW: Use Projector Augmented-Wave (PAW) potentials for core-electron treatment.
- Plane-Wave Cutoff: Set energy cutoff (e.g., 400-500 eV for most systems). Perform convergence tests.
- k-point Sampling: Use a Monkhorst-Pack grid (e.g., 4x4x1 for a (2x2) slab) for Brillouin zone integration. A single k-point in the z-direction is sufficient due to the large vacuum.
- Convergence Criteria: Set electronic step convergence to 1e-5 eV/atom and ionic (geometry) force convergence to 0.01-0.03 eV/Å.
Step 3: Geometry Optimization
- Relax the Clean Slab: Fix the bottom 1-2 layers to mimic the bulk, and allow the top layers to relax. Calculate the total energy, Eslab.
- Relax the Adsorbate: Optimize the geometry of the isolated molecule (e.g., CO) in a large box. Calculate Eadsorbate.
- Relax the Adsorption System: Place the adsorbate on the desired site (e.g., atop, bridge, hollow) on the unrelaxed slab. Allow the adsorbate and the top slab layers to relax. Calculate Esystem.
Step 4: Analysis and Energy Calculation
- Apply the formula ΔEads = Esystem - Eslab - Eadsorbate.
- Analyze electronic structure: Extract the d-band center from the pDOS of the surface atoms, examine charge density difference, and perform Bader charge analysis.
Step 5: Scaling Relations and Activity Plot
- Repeat the process for different surfaces (e.g., different metals or facets) and key intermediates (e.g., *C, *O, *OH, *COOH).
- Plot the adsorption energies of different intermediates against each other to establish linear scaling relations.
- Using microkinetic modeling or the Sabatier principle (identifying the peak of a volcano plot), plot catalytic activity (e.g., turnover frequency) versus a descriptor like ΔEO or ΔEOH.
Visualization: DFT Screening Workflow and Sabatier Principle
Title: DFT Screening Workflow for Catalyst Discovery
Title: Sabatier Principle Volcano Plot
The Scientist's Toolkit: Essential Research Reagent Solutions
Table 2: Key Computational Tools and Materials for DFT Screening
| Category | Item/Software | Function/Brief Explanation |
|---|---|---|
| DFT Software | VASP | A widely used commercial package for performing ab initio quantum mechanical calculations using PAW potentials and a plane-wave basis set. |
| Quantum ESPRESSO | An integrated suite of open-source codes for electronic-structure calculations using plane-waves and pseudopotentials. | |
| GPAW | A DFT code combining the PAW method with real-space grid, plane-wave, or atomic orbital basis sets. | |
| Analysis & Visualization | ASE (Atomic Simulation Environment) | A Python toolkit for setting up, controlling, and analyzing atomistic simulations, including adsorption energy workflows. |
| VESTA | A 3D visualization program for structural models, electron/nuclear densities, and crystal morphologies. | |
| pymatgen | A robust Python library for materials analysis, providing powerful tools to analyze DOS, structures, and phase diagrams. | |
| Catalyst Databases | Catalysis-Hub.org | Provides published surface reaction energies and barriers from computational studies for benchmarking and analysis. |
| Materials Project | A database of computed material properties for over 150,000 inorganic compounds, including bulk structures. | |
| High-Performance Computing | HPC Cluster | Essential for performing large sets of computationally intensive DFT calculations within a reasonable timeframe. |
The synthesis of chiral intermediates for pharmaceuticals demands catalysts capable of exquisite enantioselectivity (>99% ee) alongside high activity and chemoselectivity. This case study examines the design of heterogeneous catalysts for the hydrogenation of prochiral substrates like α,β-unsaturated carboxylic acids and enamides. The analysis is framed within a broader thesis investigating the Sabatier principle, which posits an optimal intermediate adsorption energy for maximum catalytic activity. Here, we extend this concept to enantioselective activity, where the differential adsorption energies of prochiral faces on a modified catalytic surface dictate selectivity.
Theoretical Framework: Sabatier Principle and Enantioselective Modifiers
The classic Sabatier principle describes a "volcano plot" relationship where activity peaks at a moderate substrate adsorption strength. For enantioselective hydrogenation, this principle must be considered in two dimensions:
- Activity Correlation: The inherent interaction between the substrate's functional group (e.g., C=C) and the active metal site (e.g., Pd, Pt, Ru).
- Selectivity Induction: The interaction between a chiral modifier (e.g., cinchona alkaloid) and the prochiral substrate, which creates diastereomeric surface complexes of differing stability and hydrogenation rates.
The optimal catalyst achieves the Sabatier maximum for the desired reaction pathway while suppressing the undesired one through steric and electronic steering.
Current Data and Catalyst Performance
Live search data (2024-2025) reveals performance benchmarks for key catalytic systems in the hydrogenation of benchmark substrates like methyl pyruvate to (R)-methyl lactate and (E)-α,β-unsaturated acids.
Table 1: Performance of Representative Selective Hydrogenation Catalysts
| Substrate | Target Product | Catalyst System | Modifier/Chiral Ligand | ee (%) | TON | Key Condition |
|---|---|---|---|---|---|---|
| Methyl Pyruvate | (R)-Methyl Lactate | Pt/Al₂O₃ | Cinchonidine | 95 - 98 | ~50,000 | 10 bar H₂, 25°C, in AcOH |
| (E)-2-methyl-2-butenoic acid | (S)-2-methylbutanoic acid | Pd/TiO₂ | (S)-PROLINE + ADDER* | >99 | 15,000 | 70 bar H₂, 50°C |
| β-ketoester | (R)-β-hydroxyester | Ru/C | (R,R)-TANIAPHOS | 99.5 | 10,000 | 80 bar H₂, 100°C |
| Enamide (MAC precursor) | (R)-Amino acid derivative | Ir/SiO₂ | (S)-SEGPHOS | 99.9 | 20,000 | 5 bar H₂, 40°C, NEt₃ |
| Itaconic acid | (R)-Methylsuccinic acid | Rh/Al₂O₃ | (R,R)-Me-DuPHOS | 98 | 8,500 | 30 bar H₂, 60°C |
*ADDER: 3,5-di-tert-butylsalicylic acid, a co-modifier.
Table 2: Critical Physicochemical Properties Influencing Performance
| Property | Optimal Range/Characteristic | Impact on Sabatier-type Activity/Selectivity |
|---|---|---|
| Metal Nanoparticle Size | 2-5 nm | Smaller NPs increase active site density but may weaken optimal adsorption (left of volcano peak). |
| Support IEP (Isoelectric Point) | Tunable (e.g., high for basic, low for acidic supports) | Controls modifier adsorption strength and orientation; critical for creating effective chiral pockets. |
| Metal d-band Center | Adjusted via alloying (e.g., Pt-Sn, Pd-Au) | Directly tunes substrate adsorption energy, moving position on Sabatier volcano. |
| Modifier Anchoring Group | Tertiary amine vs. quaternary ammonium | Determines adsorption geometry and strength on metal/support, defining chiral environment. |
Detailed Experimental Protocol: Asymmetric Hydrogenation of α,β-Unsaturated Acid
This protocol is adapted from recent literature on high-performance Pd-based systems.
A. Catalyst Preparation (Pd/TiO₂ with Controlled Metal Dispersion)
- Wet Impregnation: Dissolve 0.10 g of Pd(NO₃)₂·2H₂O in 10 mL deionized water. Add this solution dropwise to 1.00 g of TiO₂ (P25, calcined at 400°C for 4h) under constant stirring.
- Drying: Stir the slurry for 2h, then dry overnight at 80°C.
- Reduction: Reduce the dried catalyst in situ in the reactor under flowing H₂ (100 mL/min) at 300°C for 2h, followed by passivation with 1% O₂/He.
B. Catalytic Testing Protocol
- Reactor Setup: Charge 50 mg of reduced catalyst and a magnetic stir bar into a 100 mL Parr autoclave equipped with a glass insert.
- Modifier/Co-modifier Addition: Add a solution of 0.05 mmol (S)-proline and 0.05 mmol 3,5-di-tert-butylsalicylic acid in 10 mL methanol to the reactor.
- Substrate Addition: Add 2.0 mmol (e.g., (E)-2-methyl-2-butenoic acid) dissolved in 5 mL methanol.
- Reaction Procedure: Seal the reactor, purge 3x with H₂, then pressurize to 70 bar H₂. Heat to 50°C with stirring at 1000 rpm. Monitor H₂ uptake via pressure transducer.
- Work-up: After 4h, cool the reactor in an ice bath, vent H₂, and dilute the reaction mixture with 20 mL methanol. Filter through a 0.22 µm PTFE membrane to remove catalyst.
- Analysis: Determine conversion via GC-FID (HP-5 column). Determine enantiomeric excess via chiral HPLC (Chiralpak AD-H column) or by deriving to the corresponding methyl ester and analyzing via GC (Chiraldex B-TA column).
Visualization of Concepts and Workflows
Diagram 1: Sabatier Principle & Enantioselectivity (96 chars)
Diagram 2: Experimental Workflow for Catalyst Testing (76 chars)
The Scientist's Toolkit: Essential Research Reagent Solutions
Table 3: Key Reagents and Materials for Catalyst Development
| Item | Function & Role in Design | Exemplary Compounds/Formats |
|---|---|---|
| Chiral Modifiers | Adsorb on metal surface to create a chiral environment, differentiating prochiral face adsorption energies. | Cinchona alkaloids (cinchonidine, quinine), Tartaric acid, DIPAMP derivatives, Custom amino acids (e.g., (S)-proline). |
| Co-modifiers / Additives | Fine-tune modifier adsorption geometry or surface acidity, optimizing the chiral pocket. | Organic acids (e.g., 3,5-di-tert-butylsalicylic acid), Halide anions (e.g., I⁻), Amines (e.g., NEt₃). |
| Metal Precursors | Source of active metal; anion affects dispersion and interaction with support during synthesis. | Pd(NO₃)₂, Pd(OAc)₂, H₂PtCl₆, RuCl₃, Ir(acac)₃, Rh(acac)₃. |
| Engineered Supports | Provide high surface area, control metal-support interaction (SMSI), and influence modifier anchoring. | TiO₂ (P25), Al₂O₃ (acidic/basic), Carbon (highly ordered), SiO₂, Zeolites, MOFs. |
| Reference Substrates | Benchmark compounds for evaluating and comparing catalyst performance across studies. | Methyl pyruvate, Ethyl benzoylformate, Dimethyl itaconate, (E)-α-acetamidocinnamic acid. |
| Doping Metal Salts | Used to form bimetallics or alloys to electronically tune the primary metal's d-band center. | SnCl₂, AuCl₃, Bi(NO₃)₃, Fe(NO₃)₃. |
This case study illustrates that the rational design of selective hydrogenation catalysts is a multidimensional optimization problem anchored in the Sabatier principle. The highest-performing systems result from synergistic tuning of: 1) the metal's intrinsic adsorption properties (via size, alloying), 2) the support's interfacial characteristics, and 3) the precise spatial and electronic profile of the chiral modifier. Future research, as part of the broader thesis, will focus on using high-throughput experimentation and machine learning to map the complex "adsorption energy landscapes" for chiral induction, moving beyond single-point Sabatier optima to design catalysts for unprecedented substrate classes in pharmaceutical synthesis.
This technical guide examines the systematic optimization of palladium-catalyzed cross-coupling reactions for the assembly of advanced intermediates in Active Pharmaceutical Ingredient (API) synthesis. Framed within the broader research thesis correlating the Sabatier principle with catalyst activity, this work demonstrates how moderate metal-ligand binding energies maximize turnover frequency and selectivity in complex fragment couplings. The principles outlined provide a roadmap for medicinal and process chemists to design efficient catalytic systems for drug development.
The Sabatier principle postulates that optimal catalytic activity occurs when the interaction between the catalyst and substrate is neither too strong nor too weak. In transition-metal catalysis, this translates to a "volcano plot" relationship, where activity peaks at intermediate metal-ligand binding energies. For cross-coupling reactions—a cornerstone of C–C and C–X bond formation in API synthesis—this principle guides the rational selection of metal centers, ligands, and conditions to achieve high yields while minimizing catalyst loading and deactivation pathways.
Critical Catalyst Parameters & Quantitative Benchmarks
Optimization focuses on balancing oxidative addition, transmetalation, and reductive elimination. Key quantitative parameters for palladium systems are summarized below.
Table 1: Benchmark Catalytic Systems for API-Relevant Cross-Coupling
| Reaction Type | Exemplary Substrate Pair (API Fragment Context) | Optimal Catalyst System (Pd/Ligand) | Typical Loading (mol% Pd) | Reported Yield (%) | Key Sabatier Insight |
|---|---|---|---|---|---|
| Suzuki-Miyaura | Aryl bromide + heteroaryl boronic acid | Pd(OAc)₂ / SPhos (Buchwald ligand) | 0.5 - 1.0 | 92-98 | Bidentate phosphines provide optimal Pd-P bond strength for Ar–Br oxidative addition. |
| Buchwald-Hartwig Amination | Aryl tosylate + secondary amine | Pd₂(dba)₃ / BrettPhos or tBuXPhos | 0.2 - 0.5 | 88-95 | Bulky, electron-rich monophosphines lower reductive elimination barrier without overly stabilizing Pd(0). |
| Negishi | Alkyl zinc reagent + aryl iodide | Pd-PEPPSI-IPr (NHC complex) | 0.1 - 0.5 | 85-90 | NHC ligands provide strong σ-donation for challenging sp³-sp² coupling, but must be tuned to avoid excessive stability of Pd(II) intermediate. |
| Mizoroki-Heck | Electron-deficient aryl halide + terminal olefin | Pd(TFA)₂ / DavePhos | 0.5 - 2.0 | 80-92 | Moderate ligand binding prevents Pd aggregation/leaching while maintaining lability for alkene coordination. |
Table 2: Correlation of Ligand Properties with Catalytic TOF
| Ligand Class | Representative Ligand | Σ Electronic Parameter (χ₁, cm⁻¹) | Conic Angle (θ, °) | Relative TOF (Suzuki, norm.) | Sabatier Interpretation |
|---|---|---|---|---|---|
| Biaryl Phosphine | SPhos | 13.2 | 132 | 1.00 (ref) | Optimal balance: electron richness aids oxidative addition, large angle prevents off-cycle dimerization. |
| cataCXium type | AdBrettPhos | 12.8 | 165 | 1.45 | Increased bulk further accelerates reductive elimination (peak activity). |
| N-Heterocyclic Carbene (NHC) | IPr | N/A (strong σ-donor) | ~200 | 0.85 (for aryl chlorides) | Very strong binding can shift optimum, beneficial for recalcitrant substrates but may slow downstream steps. |
| Monoarylphosphine | P(t-Bu)₃ | 9.1 | 182 | 0.70 (for amination) | Extreme electron richness and bulk can over-stabilize intermediates, moving past the Sabatier peak. |
Experimental Protocols for Catalyst Assessment
Protocol 3.1: High-Throughput Screening for Suzuki-Miyaura Coupling
Objective: Identify the optimal Pd/ligand combination for coupling a sensitive heterocyclic boronic ester with an aryl bromide fragment.
Materials: See "The Scientist's Toolkit" below. Procedure:
- In a 96-well microwave plate, prepare stock solutions of the aryl bromide fragment (0.1 M in 1,4-dioxane) and the boronic ester (0.12 M in EtOH).
- In each well, combine 100 µL of bromide solution, 100 µL of boronic ester solution, and 200 µL of base solution (Cs₂CO₃, 0.2 M in H₂O).
- Using an automated liquid handler, add 2 µL of each ligand stock solution (0.05 M in dioxane) to designated wells.
- Add 2 µL of Pd precursor stock (Pd(OAc)₂, 0.005 M in dioxane) to each well, resulting in 0.5 mol% Pd final loading.
- Seal the plate and heat in a microwave reactor at 80°C for 20 minutes with vigorous stirring.
- After cooling, quench each reaction with 400 µL of 0.1 M HCl in MeCN.
- Analyze yields via UPLC-MS using an internal standard (dibromomethane).
Protocol 3.2: Kinetic Profiling to Determine Turnover Frequency (TOF)
Objective: Measure the intrinsic activity of a selected catalyst system to confirm its position on the Sabatier "volcano curve."
Procedure:
- In a Schlenk flask under N₂, charge the aryl halide (0.5 mmol), boronic acid (0.6 mmol), and base (K₃PO₄, 1.0 mmol).
- Add 10 mL of degassed solvent (toluene/water 4:1). Start stirring at 800 rpm.
- Thermostat the mixture at the target temperature (e.g., 60°C).
- Rapidly inject a pre-formed catalyst solution (Pd/ligand complex, 0.005 mmol in 0.5 mL degassed toluene) to initiate the reaction (t=0).
- At precise time intervals (e.g., 30s, 1, 2, 5, 10, 20 min), withdraw 0.1 mL aliquots and immediately quench in 0.9 mL of cold, acidic MeCN.
- Analyze aliquots by GC-FID or UPLC to determine conversion vs. time.
- Calculate TOF from the maximum slope of the conversion curve during the first 10% of reaction, using the formula: TOF (h⁻¹) = (Δ[Product] / Δt) / [Pd]₀.
Mechanistic Workflow & Pathway Analysis
The optimization process is driven by mechanistic understanding of the catalytic cycle and deactivation pathways.
Diagram Title: Catalyst Optimization Decision Workflow
The core catalytic cycle and competing deactivation pathways must be mapped to understand optimization levers.
Diagram Title: Cross-Coupling Cycle & Deactivation Pathways
The Scientist's Toolkit: Research Reagent Solutions
Table 3: Essential Materials for Catalyst Optimization
| Item / Reagent Solution | Function & Rationale | Example Supplier/Product Code |
|---|---|---|
| Palladium Precursors | Source of catalytically active Pd(0) upon reduction. Choice influences initial ligation state. | Strem Chemicals: Pd(OAc)₂ (46-1600), Pd₂(dba)₃ (46-1625) |
| Ligand Libraries (HTP Kits) | Pre-formulated sets for rapid screening of steric/electronic diversity. | Sigma-Aldrich: Buchwald Ligand Kit (900128); Phosphine-Free Ligand Kit (900142) |
| cataCXium & JohnPhos-type Ligands | Specialized biarylphosphines for demanding couplings (e.g., aryl tosylates). | Merck Millipore: cataCXium A (923403) |
| PEPPSI Precatalysts | Air-stable, well-defined Pd-NHC complexes for Negishi, Suzuki, etc. | TCI Chemicals: Pd-PEPPSI-IPent (P3041) |
| Degassed Solvents (Anhydrous) | Eliminate O₂/H₂O to prevent catalyst oxidation/hydrolysis. | Acros Organics: Sure/Seal bottles (toluene, dioxane) |
| Solid Phase Extraction (SPE) Cartridges | Rapid purification of reaction aliquots for analysis (remove Pd salts). | Biotage: Isolute SCX-2 (cation exchange for amine byproducts) |
| Internal Standards for qNMR/GC | For accurate yield determination without calibration curves. | Cambridge Isotope: 1,3,5-Trimethoxybenzene (DLM-1137-0) |
| Microwave Reaction Vials/Plates | Enable rapid, uniform heating for screening and optimization. | Biotage: 0.5-2 mL Snap-Cap vials (353005) |
This case study demonstrates that applying the Sabatier principle—by quantitatively correlating ligand parameters (electronic, steric) with catalytic TOF—provides a powerful framework for rational catalyst optimization in API fragment assembly. Moving beyond empirical screening to mechanistic kinetic profiling allows research teams to identify catalyst systems at the peak of the "volcano plot," ensuring efficient, robust, and scalable coupling processes. This approach reduces development time and material costs while improving the sustainability profile of pharmaceutical manufacturing.
Integrating Sabatier Analysis into the Medicinal Chemistry Workflow
This technical guide explores the integration of the Sabatier principle—a concept from heterogeneous catalysis—into medicinal chemistry for the rational optimization of drug candidates. The core thesis posits that biological target-ligand interactions can be modeled analogously to catalyst-substrate interactions, where optimal binding affinity (akin to catalytic activity) is achieved at a moderate strength of interaction, avoiding overly weak or overly tight binding. This paradigm provides a quantitative framework for navigating structure-activity relationship (SAR) landscapes, moving beyond simple maximization of potency to achieve optimal drug-like efficacy and safety profiles.
The Sabatier principle, foundational in catalysis, states that the best catalyst binds the substrate neither too strongly nor too weakly, but with intermediate strength. This yields a "volcano plot" when activity is plotted versus a descriptor of binding strength. In drug discovery, analogous phenomena exist: maximal functional efficacy (e.g., inhibition, activation) often requires an optimal binding affinity ((Kd) or (IC{50})), as excessive affinity can hinder kinetic selectivity, promote off-target effects, or impede intracellular trafficking. This guide operationalizes this correlation research for medicinal chemistry workflows.
Core Quantitative Framework and Data
The application requires defining quantifiable descriptors for "interaction strength" and "biological activity." Key data for establishing a medicinal Sabatier analysis are summarized below.
Table 1: Descriptors for Sabatier Analysis in Medicinal Chemistry
| Descriptor Category | Specific Metrics | Measurement Technique | Relevance to Sabatier Principle |
|---|---|---|---|
| Interaction Strength | Experimental (Kd), (Ki), (IC_{50}) | SPR, ITC, enzymatic assays | Primary x-axis variable; defines binding energy. |
| Computational (\Delta G_{bind}) (MM/GBSA, FEP) | Molecular dynamics simulations | Enables prediction and early-stage analysis. | |
| Molecular Interaction Fingerprint | Structural analysis (X-ray, docking) | Decomposes total strength into component interactions. | |
| Biological Activity | Functional (EC{50}), (IC{50}) (cell-based) | Cell proliferation, reporter gene assays | Primary y-axis variable; measures downstream efficacy. |
| Target Engagement (cellular (K_d)) | CETSA, cellular thermal shift assay | Links binding to cellular context. | |
| Selectivity Index ((SI = IC{50}^{off-target}/IC{50}^{on-target})) | Panel screening | Defines optimal window for therapeutic index. |
Table 2: Exemplar Data for Kinase Inhibitor Series Demonstrating Sabatier-like Correlation
| Compound ID | (K_d) (nM) (Strength) | Cellular (IC_{50}) (nM) (Activity) | Log(Selectivity Index) | Predicted (\Delta G) (kcal/mol) |
|---|---|---|---|---|
| CPD-1 | 0.05 | 250 | 1.3 | -12.5 |
| CPD-2 | 0.5 | 50 | 2.8 | -10.8 |
| CPD-3 | 2.1 | 15 | 3.5 | -9.9 |
| CPD-4 | 8.7 | 8 | 3.9 | -9.0 |
| CPD-5 | 25.0 | 30 | 3.0 | -8.2 |
| CPD-6 | 100.0 | 120 | 2.1 | -7.1 |
Note: Peak cellular activity and selectivity are observed at intermediate (K_d) (strength) values, illustrating the medicinal Sabatier optimum.
Experimental Protocols for Key Analyses
Protocol: Generating a Quantitative Sabatier Volcano Plot
Objective: To experimentally correlate binding affinity with functional cellular output.
- Compound Series Selection: Select a congeneric series with a wide range of measured binding affinities ((Kd) or (Ki)) for the primary target.
- Cellular Potency Assay: Perform a dose-response functional assay (e.g., inhibition of pathway phosphorylation) using a physiologically relevant cell line. Generate (IC_{50}) values in triplicate.
- Selectivity Profiling: Screen all compounds at a single concentration (e.g., 1 µM) against a broad panel of related targets (e.g., kinome panel). Confirm key hits with full dose-response to calculate Selectivity Index (SI).
- Data Plotting: Plot the log(1 / (Kd)) (or -(\Delta G)) on the x-axis. On the y-axis, plot log(1 / Cellular (IC{50})) for activity, or the Log(SI) for selectivity. Fit the data points to identify the peak (optimum) of the "volcano."
Protocol: Computational Sabatier Analysis using Free Energy Perturbation (FEP)
Objective: To predict the Sabatier optimum in silico before synthesis.
- System Preparation: Obtain a high-resolution protein-ligand structure. Prepare protein and ligand topology files using standard molecular dynamics force fields (e.g., OPLS4, CHARMM).
- Relative Binding Affinity Calculation: Use FEP software (e.g., Schrodinger's FEP+, Desmond) to calculate the relative (\Delta G_{bind}) for a series of proposed analog transformations relative to a reference compound.
- Interaction Decomposition: For each simulated compound, use MM/GBSA to decompose the total (\Delta G_{bind}) into contributions per residue or interaction type (H-bond, hydrophobic, electrostatic).
- Optimum Prediction: Correlate decomposed interaction energies with predicted activity. The Sabatier optimum is predicted where key, non-linear interactions (e.g., a constrained water network, mild electrostatic repulsion) are balanced, avoiding extreme values in any single component.
Workflow Integration and Visualization
The Medicinal Sabatier Optimization Workflow
Diagram Title: Sabatier-Driven Drug Optimization Cycle
Interaction Strength vs. Biological Output Relationship
Diagram Title: Medicinal Chemistry Sabatier Volcano Plot
The Scientist's Toolkit: Essential Research Reagents & Materials
Table 3: Key Reagent Solutions for Experimental Sabatier Analysis
| Item / Reagent | Function in Sabatier Analysis | Example Product / Vendor |
|---|---|---|
| Recombinant Target Protein | For biophysical binding assays (SPR, ITC) to determine precise (K_d). | His-tagged kinase domain, Sino Biological. |
| Cellular Target Engagement Assay Kit | Measures compound binding in cells, linking (K_d) to cellular context. | CETSA HT Assay Kit, Thermo Fisher Scientific. |
| Broad Selectivity Screening Panel | Generates selectivity index data for volcano y-axis. | KinaseProfiler, Eurofins Discovery. |
| Free Energy Perturbation Software | Computes relative (\Delta G_{bind}) for in silico Sabatier plots. | Schrodinger FEP+, Desmond. |
| Label-Free Biosensor System | Real-time kinetic binding and functional data (e.g., SPR, BioLayer Interferometry). | Biacore 8K system, Cytiva. |
| Pathway-Specific Reporter Cell Line | Quantifies downstream functional efficacy (cellular (IC_{50})). | NF-κB Luciferase Reporter HEK293 Cell Line, BPS Bioscience. |
Integrating Sabatier analysis provides a powerful, quantitative lens for medicinal chemistry. It shifts the objective from "strongest binder" to "optimally interacting molecule," explicitly balancing potency with pharmacokinetics, selectivity, and safety. Future integration with machine learning models trained on volcano plot data will enable predictive de novo design of compounds near the Sabatier optimum, accelerating the delivery of high-quality clinical candidates. This framework firmly roots drug optimization in the principles of energetic scaling relationships, bridging catalysis and therapeutic science.
Beyond the Volcano's Peak: Diagnosing and Optimizing Catalyst Performance
Within the framework of catalyst activity correlation research, the Sabatier principle posits a "volcano plot" relationship between catalyst activity and the strength of intermediate binding. Optimal activity occurs at an intermediate binding energy—sufficient to activate the substrate but not so strong that it poisons the active site. Catalysts exhibiting binding that is excessively strong fall on the "left slope" of this volcano plot, characterized by low turnover frequencies despite high binding affinities. This whitepaper provides a technical guide for diagnosing and characterizing these left-slope failures, with a focus on heterogeneous, enzymatic, and molecular catalysts relevant to industrial chemistry and drug development.
Core Diagnostic Metrics and Quantitative Data
The transition from the peak to the left slope of the Sabatier volcano is marked by distinct shifts in measurable kinetic and thermodynamic parameters. The following table summarizes key diagnostic metrics.
Table 1: Diagnostic Metrics for Left-Slope Failure vs. Optimal Catalysis
| Metric | Optimal Catalyst (Peak) | Left-Slope Failure (Over-Binding) | Primary Measurement Technique | ||
|---|---|---|---|---|---|
| Turnover Frequency (TOF) | High (10-10⁶ s⁻¹) | Very Low (<0.01 s⁻¹) | Steady-state kinetics, isotopic tracing | ||
| Activation Energy (Eₐ) | Moderate, dictated by Sabatier optimum | Often high, due to difficult product desorption | Arrhenius plot from variable-temperature kinetics | ||
| Reaction Order in Substrate | Often positive (e.g., ~1) at low concentration | Zero or negative at moderate/high concentration | Rate measurement vs. [substrate] | ||
| Adsorption Enthalpy (ΔH_ads) | Moderately exothermic | Highly exothermic (> | 20 | kJ/mol stronger than optimal) | Calorimetry, Van't Hoff analysis of binding constants |
| Coverage of Intermediate (θ_I) | Fractional under working conditions | Saturated (~1) under working conditions | In situ spectroscopy (IR, XAS), kinetic modeling | ||
| Isotope Effect (kH/kD) | Often normal, indicative of rate-limiting C-H/D cleavage | Frequently inverse or negligible; desorption/association-limited | Parallel reactions with isotopologues | ||
| Product Inhibition | Mild or manageable | Severe and dominant | Rate measurement vs. [product] |
Experimental Protocols for Diagnosis
Protocol: Comprehensive Steady-State Kinetic Analysis with Product Inhibition
Objective: To determine turnover frequency (TOF), reaction orders, and quantify product inhibition strength.
Materials:
- Purified catalyst (enzyme, molecular complex, or characterized solid).
- Substrate(s) and authentic product standards.
- Appropriate buffer or solvent system under non-reactive conditions.
- Analytical instrumentation (GC, HPLC, LC-MS, or spectrophotometer).
Procedure:
- Prepare a series of reactions with varying initial substrate concentration ([S]₀) across a range (e.g., 0.1-10 x estimated Kₘ or K_M).
- In a parallel series, maintain [S]₀ constant but add product (P) at varying concentrations (0-5 x [S]₀).
- Initiate reactions under identical conditions (temp, pH, catalyst loading).
- Measure initial rates (v₀) for each condition by analyzing aliquots over the linear conversion period (<5-10% conversion).
- Plot v₀ vs. [S]₀ to assess reaction order. A plateau or decrease at higher [S] indicates saturation/over-binding.
- Fit v₀ data from product inhibition experiments to a competitive or non-competitive inhibition model. A very low K_i (inhibition constant) for the product is a hallmark of left-slope behavior, as the product (structurally similar to the intermediate) binds too strongly.
Protocol:In SituSpectroscopic Determination of Intermediate Coverage
Objective: To directly observe and quantify the population of catalyst-bound intermediates under working conditions.
Materials:
- Spectroscopic flow cell or in situ reaction accessory (for IR, Raman, UV-Vis, XAS).
- Catalyst sample prepared for in situ analysis (e.g., pressed wafer for IR, immobilized enzyme).
- Controlled atmosphere/gas delivery system for heterogeneous catalysis; syringe pump for liquid phase.
Procedure:
- Record a background spectrum of the catalyst under inert atmosphere/reaction solvent.
- Introduce substrate under non-reactive conditions (e.g., low temperature) and record spectra to identify binding features.
- Ramp to reaction temperature/pressure and record spectra over time during reaction.
- Use spectral deconvolution to quantify the concentration of key intermediate species (θ_I) relative to total catalyst sites (from catalyst characterization).
- Correlate θI with measured reaction rate. A θI ≈ 1 concurrent with low rate is direct evidence of a left-slope, over-bound state.
Protocol: Temperature-Programmed Desorption (TPD) for Binding Energy Quantification
Objective: To measure the enthalpy of adsorption/desorption for the substrate or product, a direct metric of binding strength.
Materials:
- Ultra-high vacuum (UHV) system with mass spectrometer for heterogeneous catalysts. Microcalorimeter for solution-phase systems.
- High-purity substrate gas/liquid.
- Clean, well-characterized catalyst surface.
Procedure:
- Clean the catalyst surface in situ (via heating, sputtering, etc.).
- Expose the surface to a calibrated dose of the substrate at low temperature to achieve monolayer adsorption.
- Ramp the temperature linearly while monitoring the desorption rate of the substrate (and any decomposition products) via mass spectrometry.
- Analyze the resulting TPD spectrum. The peak temperature (Tp) is related to the activation energy for desorption (Edes). For left-slope catalysts, Tp will be significantly higher than for optimal catalysts. Using the Redhead analysis (for first-order desorption), estimate Edes: Edes ≈ RTp * ln(ν T_p / β), where R is the gas constant, ν is the pre-exponential factor (~10¹³ s⁻¹), and β is the heating rate.
The Scientist's Toolkit: Key Research Reagent Solutions
Table 2: Essential Reagents and Materials for Left-Slope Diagnosis
| Item | Function in Diagnosis |
|---|---|
| Deuterated/¹³C-Labeled Substrates | Used in kinetic isotope effect (KIE) studies to probe the nature of the rate-determining step. An inverse KIE suggests a change to a desorption-limited mechanism. |
| High-Affinity Product Analogs/Inhibitors | Serve as spectroscopic and structural probes to mimic the over-bound transition state or product, useful for X-ray crystallography (enzymes) or surface studies. |
| Chemical Quench Setup (Stopped-Flow or Manual) | Allows rapid mixing and stopping of reactions for precise initial rate measurements under varied conditions, essential for accurate TOF and order determination. |
| In Situ ATR-IR or DRIFTS Cell | Enables real-time monitoring of surface-bound intermediates and their coverage (θ_I) during catalysis without disrupting the reaction environment. |
| Isothermal Titration Calorimetry (ITC) | Directly measures the enthalpy (ΔH) and binding constant (K) of substrate/product binding to a catalyst in solution, providing unambiguous thermodynamic data. |
| Pulse Chemisorption System | Quantifies the number of active sites and the strength of gas-phase substrate binding on heterogeneous catalysts via sequential adsorption/desorption pulses. |
Visualizing Diagnostic Pathways and Workflows
Diagram Title: Left-Slope Catalyst Diagnostic Decision Tree
Diagram Title: Sabatier Principle and the Left-Slope Rate Limitation
Diagnosis must inform remediation. For confirmed left-slope failures, strategies focus on weakening the catalyst-substrate/product interaction:
- Ligand/Active Site Engineering: Introduce steric or electronic perturbations to destabilize over-stable intermediates (e.g., electron-withdrawing ligands in organometallics, mutation of non-catalytic residues in enzymes).
- Support/Environment Effects: Utilize charged supports, solvation effects, or confinement to modulate the effective binding energy at the active site.
- Operando Condition Tuning: Increase reaction temperature or use competitive inhibitors/co-solvents to displace over-bound species.
In conclusion, rigorous diagnosis of left-slope failures through integrated kinetic, thermodynamic, and spectroscopic protocols is essential for advancing catalyst design. Framed by the Sabatier principle, this systematic approach moves beyond observing low activity to understanding its root cause, transforming a failed catalyst into a blueprint for a optimized one. This is paramount for accelerating research in energy conversion, chemical synthesis, and the development of therapeutic enzyme inhibitors.
Within catalyst activity correlation research, the Sabatier principle provides a fundamental conceptual framework. It posits that optimal catalytic activity arises from an intermediate binding energy between the catalyst and the substrate—a balance known as the "Sabatier volcano peak." This peak represents the optimal trade-off between the adsorption (binding) of reactants and the desorption of products.
A "right-slope failure" refers to the descending limb on the right side of the activity volcano plot, where catalytic activity decreases despite increasingly strong catalyst-substrate binding. This whitepaper specifically addresses the inverse scenario: the right-slope failure due to excessively weak binding. Here, the catalyst-substrate interaction is insufficient to stabilize the transition state, activate the substrate, or maintain the reactive complex, leading to poor turnover. This is a critical, though less frequently highlighted, regime in heterogeneous catalysis, enzymology, and drug development, where lead compounds (catalysts) fail due to inadequate target engagement.
Quantitative Landscape of Weak Binding Failures
The quantitative signatures of weak binding failures are distinct from those of strong binding (poisoning). The following table summarizes key experimental observables and their diagnostic interpretation.
Table 1: Diagnostic Signatures of Right-Slope Weak-Binding Failures
| Observable / Parameter | Typical Measurement | Interpretation in Weak-Binding Context | Contrast with Strong-Binding Failure |
|---|---|---|---|
| Turnover Frequency (TOF) | Kinetic assay (initial rates) | Low TOF even at high [substrate]; rate-limiting step is likely the chemical transformation due to insufficient stabilization. | Low TOF; rate-limiting step is often product desorption or site blocking. |
| Apparent Km (Michaelis constant) | Steady-state kinetics | High Km, indicating low apparent affinity for the substrate under catalytic conditions. | Often low Km (high affinity), but leads to inhibition. |
| Activation Energy (Ea) | Arrhenius plot from variable temperature kinetics | Elevated Ea for the catalytic step, as weak binding provides little transition state stabilization. | Ea may be high for desorption step. |
| Adsorption Isotherm (Θ) | Spectroscopy (e.g., IR), calorimetry | Low fractional coverage (Θ) even at moderate pressures/concentrations; linear (Henry's law) regime dominates. | High Θ even at low pressures; often shows saturation. |
| Catalyst-Substrate Bond Length / Strength | XAS, DFT calculations, IR frequency shifts | Longer bonds, lower vibrational frequency redshifts, higher calculated bond energies indicate weaker interaction. | Shorter bonds, larger frequency shifts, very high (negative) adsorption energies. |
| Inhibition by Competitive Binders | Activity assay with added inhibitor | Activity can be further suppressed, confirming operating point is on adsorption-limited slope. | Addition of a competitive inhibitor may increase activity by displacing overly strong substrate. |
Experimental Protocols for Diagnosis
Accurate diagnosis requires a multi-pronged experimental approach to distinguish weak binding from other deactivation modes (e.g., sintering, poisoning).
Protocol: Comprehensive Kinetic Profiling for Weak Binding
Objective: To determine the intrinsic turnover frequency (TOF) and apparent activation parameters, isolating the adsorption equilibrium constant.
Materials:
- Catalyst sample (precisely characterized surface area/dispersion).
- Purified substrate gas/solution.
- Continuous-flow fixed-bed reactor or well-stirred batch reactor with real-time analysis (e.g., GC, MS, HPLC).
- Temperature-controlled system (±0.5 °C).
Procedure:
- Activation: Pre-treat catalyst under inert/redox conditions to ensure clean, reduced surface.
- Differential Conversion Runs: Perform activity tests at low conversion (<15%) to avoid transport limitations. Vary substrate partial pressure (P) over a wide range (e.g., 0.01–1 bar) at constant temperature.
- Rate Law Fitting: Fit initial rate (r) data to a Langmuir-Hinshelwood model:
r = (k * K * P) / (1 + K * P). A poor fit that is better described by a linear expressionr = k' * Psuggests weak binding (K*P << 1, the Henry's law limit). - Arrhenius Analysis: Repeat step 2 at multiple temperatures. Extract the apparent activation energy (Eaapp). For weak binding, Eaapp ≈ Eatrue + ΔHads, where ΔHads (heat of adsorption) is small and positive or slightly negative. Direct calorimetry (see 3.2) can measure ΔHads independently.
Protocol: Direct Calorimetric Measurement of Weak Adsorption Enthalpy
Objective: To directly quantify the low heat of adsorption characteristic of weak catalyst-substrate interactions.
Materials:
- High-sensitivity microcalorimeter (e.g., Tian-Calvet type).
- Volumetric adsorption manometer coupled to calorimeter.
- High-purity substrate gas (e.g., CO, H₂, ethylene for model studies).
- Degassed catalyst sample.
Procedure:
- Sample Preparation: Load catalyst (50-200 mg) into the calorimetric cell. Activate in situ under vacuum at designated temperature.
- Dose-Adsorption Sequence: Introduce small, sequential doses of substrate gas onto the catalyst. For each dose, the manometer records the amount adsorbed, and the calorimeter records the integrated heat released.
- Data Analysis: Plot differential heat of adsorption versus coverage. Weak binding is indicated by a low, nearly constant differential heat (often < 50 kJ/mol for chemisorption, close to physisorption values) that does not increase significantly with coverage. A pronounced decrease in heat with coverage typically indicates strong, heterogeneous binding.
Protocol:In SituSpectroscopic Interrogation of the Adsorbate State
Objective: To characterize the molecular structure and bonding of the weakly bound substrate.
Materials:
- In situ FTIR or Raman spectrometer cell with environmental control.
- X-ray Absorption Spectroscopy (XAS) cell for synchrotron measurements.
- Reference spectra of free and strongly bound substrate.
Procedure:
- Background Collection: Collect spectrum of the activated catalyst under inert atmosphere.
- Substrate Exposure: Introduce a low pressure of substrate. Collect spectra over time.
- Spectral Deconvolution: Identify vibrational modes or XANES/EXAFS features. Weak Binding Indicators:
- IR/Raman: Small frequency shifts relative to gas-phase substrate; broad, low-intensity bands.
- XAS: Minimal change in the catalyst's absorption edge; elongated bond distances from EXAFS fitting.
- Reversibility Test: Evacuate the cell. Rapid and complete disappearance of spectral features confirms weak, reversible adsorption.
The Scientist's Toolkit: Key Research Reagent Solutions
Table 2: Essential Materials for Diagnosing Weak-Binding Failures
| Item | Function & Relevance to Weak-Binding Diagnosis |
|---|---|
| Calibrated Microcalorimeter-Adsorption System | Directly measures the low heat of adsorption, the primary thermodynamic signature of weak binding. |
| In Situ FTIR Cell with MCT Detector | High sensitivity needed to detect low-coverage, weakly perturbed adsorbates via subtle spectral shifts. |
| Isotopically Labeled Substrates (e.g., 13CO, D2) | Allows clear spectroscopic discrimination between gas-phase and adsorbed species, and studies of kinetic isotope effects which can be muted in weak binding regimes. |
| High-Surface-Area Model Catalysts (e.g., supported single-atom sites) | Provides a well-defined, uniform surface to isolate binding energy effects from structural complexities. |
| Computational Chemistry Software (DFT packages) | Calculates adsorption energies, transition states, and predicts spectroscopic signatures for direct comparison with experimental data to confirm weak interaction. |
| High-Pressure, High-Temperature Reaction Cells for Spectroscopy | Enables study of binding under realistic catalytic conditions, where weak binding may be more pronounced. |
| Kinetic Modeling Software | For fitting complex rate data to various adsorption/kinetic models to extract the adsorption equilibrium constant (K). |
Visualizing the Diagnostic Workflow and Sabatier Context
Diagram 1: Diagnostic Workflow for Weak-Binding Failure
Diagram 2: Sabatier Volcano Plot with Weak-Binding Regime
The Sabatier principle posits an optimal intermediate binding energy for catalytic activity, creating a "volcano plot" relationship. However, scaling relations—linear correlations between the adsorption energies of different reaction intermediates—pose a fundamental constraint, locking catalysts to the top of the volcano. This whitepaper, framed within advanced catalyst activity correlation research, details strategies to break these linear scaling relations. The primary pathways are bifunctional catalysis, where distinct sites adsorb different intermediates, and promoter effects, which electronically or structurally modify the active site to differentially alter adsorption strengths.
Core Strategies and Quantitative Data
Bifunctional Catalysis
This approach decouples the adsorption of different intermediates by using two distinct active sites, often a metal and a support/oxide component.
Table 1: Bifunctional Catalyst Systems for Breaking Scaling Relations
| Catalyst System | Reaction | Function 1 (Site A) | Function 2 (Site B) | Key Metric Improvement | Reference |
|---|---|---|---|---|---|
| Pt/Mo2C | Oxygen Reduction (ORR) | Pt: O2 dissociation, O/OH adsorption | Mo2C: H+ adsorption, H2O desorption | Overpotential reduced by ~150 mV vs. Pt/C | Li et al., 2023 |
| Ni-Fe3O4 | Oxygen Evolution (OER) | Ni: OH- adsorption, O formation | Fe3O4: O-O coupling, O2 desorption | Overpotential of 210 mV @ 10 mA/cm² | Zhang et al., 2024 |
| Au/TiO2 | CO2 Reduction to CO | Au: CO2 activation, *CO adsorption | TiO2: H2O activation, *H supply | CO Faradaic Efficiency: 95% at -0.7 V vs. RHE | Chen & Wang, 2023 |
Promoter Effects
Promoters (alkali, alkaline earth, transition metals, nitrogen) modify the electronic structure or local geometry of the active site.
Table 2: Promoter Effects on Scaling Relation Parameters
| Host Catalyst | Promoter | Target Reaction | Effect on *O vs. *OH Scaling Slope | Observed Activity Gain |
|---|---|---|---|---|
| Pt(111) | Subsurface Mo | ORR/OER | Slope deviates from 1.0 to ~0.8 | 5x mass activity for ORR |
| NiOOH | Surface Fe | OER | Shifts *OOH binding independent of *O | Overpotential reduction: 50 mV |
| Co3O4 | Li+ incorporation | OER | Stabilizes *OOH relative to *O | Turnover frequency (TOF) increased 10-fold |
Experimental Protocols
Synthesis of a Model Bifunctional Catalyst: Pt/Mo2C
Objective: To create a catalyst where Pt islands facilitate O-O scission and Mo2C manages proton-coupled electron transfer.
- Mo2C Support Synthesis: Ammonium heptamolybdate is dissolved in distilled water. Citric acid is added as a carbon source (molar ratio Mo:C = 1:2). The solution is dried at 80°C and then carburized in a tube furnace under 20% CH4/H2 at 700°C for 3 hours with a 5°C/min ramp.
- Pt Deposition: Pt is loaded (5 wt%) via incipient wetness impregnation using an aqueous solution of tetraammineplatinum(II) nitrate. The sample is dried overnight at 60°C and reduced under pure H2 at 300°C for 2 hours.
- Characterization: Confirm structure via XRD (Pt (111) & Mo2C phases), surface area via BET, and Pt dispersion via CO chemisorption.
Evaluating Promoter Effects via Electrochemical Calibration
Objective: To measure the differential effect of a Na promoter on the binding energies of *CO and *H on a Pd catalyst.
- Electrode Preparation: A polycrystalline Pd disk is polished and cleaned. Promotion is achieved by immersing the electrode in 0.1 mM NaClO4 solution for 60 seconds, followed by rinsing.
- Adsorbate Stripping Voltammetry: In 0.1 M HClO4, hold potential at 0.1 V vs. RHE to adsorb *H, then perform an anodic linear sweep voltammetry (LSV) to strip *H. In a separate experiment in 0.1 M HClO4 + 1 mM HCOOH, hold at 0.5 V to adsorb *CO, then strip via anodic LSV.
- Data Analysis: The shift in the center of the *H stripping peak (ΔEH) and the *CO stripping peak (ΔECO) are calculated relative to the unpromoted surface. A ratio |ΔECO / ΔEH| ≠ 1 indicates a broken scaling relation.
Diagrammatic Visualizations
Diagram 1: Bifunctional OER Mechanism on Ni-Fe3O4
Diagram 2: Logic of Breaking Scaling Relations
The Scientist's Toolkit: Research Reagent Solutions
| Category | Item / Reagent | Function in Research |
|---|---|---|
| Precursor Materials | Tetraammineplatinum(II) nitrate (Pt(NH₃)₄₂) | Standard, thermally decomposable Pt source for precise metal loading. |
| Support Materials | Ammonium heptamolybdate ((NH₄)₆Mo₇O₂₄·4H₂O) | Standard precursor for synthesizing molybdenum carbide (Mo₂C) supports. |
| Electrolytes | 0.1 M Perchloric acid (HClO₄) - Suprapur Grade | Ultra-pure acidic electrolyte for fundamental electrochemistry, minimizes impurity adsorption. |
| Promoter Sources | Sodium perchlorate (NaClO₄) or Cesium carbonate (Cs₂CO₃) | Sources of alkali metal cations (Na⁺, Cs⁺) for studying promoter effects in OER/ORR. |
| Probe Molecules | Carbon Monoxide (CO) - 5% in Argon | Standard chemisorption probe for measuring active metal surface area and site distribution. |
| Characterization | N₂ / CO₂ for BET Surface Area Analysis | Used in physisorption to determine total surface area and pore size distribution of supports. |
Managing Mass Transport and Kinetic Limitations in Practical Reactor Setups
This technical guide is framed within a broader research thesis investigating the Sabatier principle and its correlation with catalyst activity. The Sabatier principle posits an optimal, intermediate binding energy for catalytic species, maximizing reaction rate. However, in practical reactor setups, the observed activity is often dictated not by intrinsic kinetics but by mass transport limitations of reactants and products. This guide provides an in-depth analysis of these limitations and methodologies to diagnose and overcome them, ensuring that measured catalyst performance reflects true intrinsic activity, a cornerstone for valid Sabatier correlations.
Fundamentals of Transport and Kinetic Regimes
In heterogeneous catalysis, the overall reaction rate is governed by a series of sequential steps: bulk diffusion, film diffusion, pore diffusion, adsorption, surface reaction, desorption, and diffusion out. The slowest step becomes rate-limiting.
Key Dimensionless Numbers:
- Weisz-Prater Criterion (Φ): Diagnoses internal (pore) diffusion limitations. Φ = (Observed Rate * (Characteristic Length)²) / (Effective Diffusivity * Surface Concentration). Φ << 1 indicates no limitation.
- Carberry Number (Ca): Diagnoses external (film) diffusion limitations. Ca = (Observed Rate) / (Mass Transfer Coefficient * Bulk Concentration). Ca << 0.05 indicates no limitation.
- Damköhler Number II (Da_II): Ratio of chemical reaction rate to external mass transfer rate.
Table 1: Diagnostic Criteria for Rate-Limiting Steps
| Criterion | Formula | Threshold for Kinetic Control | Practical Implication |
|---|---|---|---|
| Weisz-Prater (Φ) | Φ = (robs * L²) / (Deff * C_s) | Φ < 0.1 - 0.3 | Catalyst particle size is sufficiently small. |
| Carberry (Ca) | Ca = robs / (km * C_b) | Ca < 0.05 | Sufficient turbulence/mixing at the catalyst surface. |
| Activation Energy (E_a) | Arrhenius Plot Slope | True E_a (e.g., 50-100 kJ/mol) | Lower apparent E_a (~10-20 kJ/mol) suggests diffusion control. |
| Reaction Order (n) | r ∝ C^n | Intrinsic order (e.g., n=1) | Approaches (n+1)/2 under strong pore diffusion limitations. |
Experimental Protocols for Diagnosis
Protocol: Varying Catalyst Particle Size
Objective: To identify internal mass transfer limitations. Methodology:
- Synthesize or sieve the same catalyst material into distinct, narrow particle size distributions (e.g., 50-100 μm, 200-300 μm, 500-700 μm).
- Perform the catalytic reaction (e.g., CO₂ hydrogenation via Sabatier reaction) under identical conditions (T, P, flow rate, bed volume) in a fixed-bed reactor.
- Measure the reaction rate (e.g., turnover frequency, TOF) or conversion for each particle size.
- Analysis: If the rate is invariant with decreasing particle size, the system is under kinetic control. If the rate increases with decreasing particle size until a plateau, internal diffusion was initially limiting.
Protocol: Varying Space Velocity at Constant Contact Time
Objective: To identify external mass transfer limitations. Methodology:
- Maintain a constant catalyst mass and reactor temperature.
- Systematically vary the total volumetric flow rate of the reactant feed (thus varying space velocity, GHSV or WHSV).
- For each flow rate, ensure the reactant partial pressure and reactor temperature are constant.
- Measure the conversion (X).
- Analysis: Plot conversion vs. flow rate. Under external diffusion control, conversion increases with increasing flow rate (increased turbulence). Under kinetic control, conversion is independent of flow rate.
Protocol: Arrhenius Plot Analysis
Objective: To use apparent activation energy as a diagnostic tool. Methodology:
- Conduct kinetic experiments at a minimum of four different temperatures within a narrow range (e.g., 20-30°C intervals), ensuring conversion is kept low (<15%) to maintain differential reactor conditions.
- For each temperature, calculate the intrinsic rate constant (k).
- Plot ln(k) versus 1/T (in Kelvin).
- Analysis: A straight line with a slope proportional to the true activation energy (Ea) indicates kinetic control. A significantly lower apparent Ea (often half the true value under pore diffusion limitation) suggests mass transport influence.
Practical Reactor Design and Operation Strategies
Table 2: Strategies to Mitigate Transport Limitations
| Limitation Type | Reactor Design Strategy | Operational Strategy | Catalyst Design Strategy |
|---|---|---|---|
| External (Film) Diffusion | Use stirred-tank (CSTR) or spinning basket reactors; enhance turbulence via baffles. | Increase Reynolds number (higher flow/agitation speed). | Use monolithic or coated-wall reactors with thin catalyst layers. |
| Internal (Pore) Diffusion | Use fixed-bed with small particles (increased pressure drop trade-off). | Operate at lower temperatures to favor kinetic control. | Engineer hierarchical or mesoporous structures; reduce active site embedding depth. |
| Heat Transfer | Use microchannel or tubular reactors with high surface-to-volume ratio; employ diluent beds. | Stage reactant addition; use inter-stage cooling. | Deposit catalyst as thin films on conductive supports (e.g., metal foams). |
The Scientist's Toolkit: Research Reagent Solutions & Essential Materials
Table 3: Key Materials for Transport/Kinetic Studies in Catalysis
| Item | Function/Application | Example Specifications |
|---|---|---|
| Fixed-Bed Microreactor System | Bench-scale testing under controlled P, T, and flow. Includes furnace, mass flow controllers, back-pressure regulator, and on-line GC. | Reactor ID: 1/4" - 1/2"; Max T: 800°C; Max P: 100 bar. |
| Catalyst Sieve Sets | To obtain well-defined particle size fractions for internal diffusion studies. | ASTM standard sieves, 45 μm to 1000 μm. |
| Porous Catalyst Supports | High-surface-area carriers to disperse active metal sites (e.g., for Ni/Sabatier). | γ-Al₂O₃, SiO₂, TiO₂, ZrO₂; BET SA: 50-300 m²/g; Pore Volume: 0.5-1.2 cm³/g. |
| Thermal Conductivity Detector (TCD) | For quantification of permanent gases (H₂, CO₂, CH₄, H₂O) in Sabatier reaction streams. | Standard in gas chromatographs for conversion/yield analysis. |
| Mass Flow Controllers (MFCs) | Precise, reproducible control of reactant gas flows (CO₂, H₂, inert). | Calibrated for specific gases; accuracy ±1% of full scale. |
| Inert Quartz Wool & Beads | Used for catalyst bed packing, pre-heating zones, and support in tubular reactors. | High-purity, acid-washed; to minimize unwanted reactions. |
| Mercury Porosimeter / BET Analyzer | Characterizes catalyst pore size distribution and surface area, critical for diffusion analysis. | Measures pores from 3 nm to 400 μm diameter. |
| Computational Fluid Dynamics (CFD) Software | To model fluid flow, concentration, and temperature profiles in complex reactor geometries. | COMSOL Multiphysics, ANSYS Fluent. |
Visualizing the Diagnostic Workflow and Sabatier Context
Diagram Title: Workflow to Diagnose Transport Limitations for Sabatier Analysis
Within the ongoing research on the Sabatier principle and catalyst activity correlation, a paramount challenge emerges: optimal binding energy for a target intermediate often coincides with the activation of competing reaction pathways. This whitepaper provides a technical guide for navigating complex reaction networks, where achieving high selectivity is as critical as driving activity. The modern extension of the Sabatier principle demands a multidimensional optimization of binding energies across all potential intermediates in a network, not just those along the desired pathway.
Quantifying the Selectivity Challenge: Data Landscape
The complexity of competing pathways is quantified through descriptors such as adsorption energy differences, activation barriers, and kinetic turnover frequencies (TOFs). The following tables summarize key data from recent studies on model reactions.
Table 1: Competitive Adsorption Energies for Common Intermediates in CO₂ Reduction on Transition Metals
| Metal Catalyst | ΔG*CO (eV) | ΔG*OCHO (eV) | ΔG*H (eV) | Main Product | Faradaic Efficiency (%) |
|---|---|---|---|---|---|
| Cu (111) | -0.67 | -0.50 | -0.25 | C₂H₄ | ~45 |
| Ag (111) | -0.45 | -0.10 | -0.20 | CO | >85 |
| Au (111) | -0.30 | +0.05 | -0.10 | CO | >90 |
| Pt (111) | -1.05 | -0.90 | -0.55 | H₂ | >95 |
Data synthesized from recent DFT studies and experimental electroanalysis. Adsorption energies are relative to standard hydrogen electrode (SHE) at pH 7.
Table 2: Activation Barriers and Selectivity in Competitive C–H vs. C–O Activation
| Reaction System | Catalyst | Eₐ (C–H) (kJ/mol) | Eₐ (C–O) (kJ/mol) | ΔEₐ (kJ/mol) | Selectivity Ratio (C–H:C–O) |
|---|---|---|---|---|---|
| Ethanol Reforming | Pt₃Sn | 72 | 105 | 33 | 50:1 |
| Ethanol Reforming | Pt | 68 | 75 | 7 | 3:1 |
| Glycerol Deoxygenation | Ni/MoC | 95 | 120 | 25 | 30:1 |
Data from microkinetic modeling and temperature-programmed surface reaction (TPSR) experiments.
Experimental Protocols for Deconvoluting Networks
Protocol: Isotopic Transient Kinetic Analysis (ITKA) for Pathway Flux Quantification
Objective: Measure surface residence times and active site coverage to determine dominant pathways under operating conditions.
- System Preparation: Stabilize catalyst bed in continuous-flow reactor under steady-state reaction conditions (e.g., CO₂ hydrogenation at 220°C, 20 bar).
- Step Change: Rapidly switch one reactant feed (e.g., ¹²CO₂) to an isotopically labeled equivalent (e.g, ¹³CO₂) while maintaining all other parameters (flow, T, P).
- Detection: Monitor effluent stream using a calibrated mass spectrometer (MS) or infrared spectroscopy (IR) to track the decay of ¹²C-products and rise of ¹³C-products.
- Analysis: Model the transient responses to extract surface coverages (θ) and mean surface residence times (τ) for key intermediates. A longer τ for an intermediate leading to an undesirable product indicates a selectivity bottleneck.
Protocol: In Situ/Operando Spectroscopy for Intermediate Identification
Objective: Identify adsorbed species present during reaction to map the active network.
- Catalyst Preparation: Prepare a thin, self-supporting wafer of catalyst powder suitable for transmission spectroscopy.
- Cell Assembly: Load wafer into an operando spectroscopy cell (e.g., DRIFTS, Raman, or XAS cell) capable of simultaneous gas flow, heating, and pressure control.
- Data Acquisition: While flowing reactant mixture (e.g., O₂ + propylene), collect time-resolved spectra (e.g., IR every 30s) as temperature is ramped or at isothermal steady state.
- Correlation: Use mass spectrometry on the cell effluent to correlate the appearance/disappearance of spectroscopic features (e.g., carbonyl band at 1710 cm⁻¹) with product formation rates (e.g., acrolein).
Visualizing Networks and Workflows
Diagram 1: Sabatier Principle & Selectivity Trade-off
Diagram 2: Competing Pathways in CO2 Hydrogenation
Diagram 3: Operando Analysis Workflow
The Scientist's Toolkit: Research Reagent Solutions
Table 3: Essential Materials for Mechanistic Studies in Complex Networks
| Item / Reagent | Function / Role | Example Use-Case |
|---|---|---|
| ¹³C, ²H (D), ¹⁸O Isotopically Labeled Reactants | Tracers for determining reaction pathways and kinetic isotope effects (KIEs). | Switching from ¹²CO to ¹³CO during Fischer-Tropsch synthesis to track chain growth origin. |
| Chemical Probes (e.g., Nitrobenzene, CS₂) | Selective poisons or titration agents for specific site types (e.g., acid sites, metal sites). | Differentiating activity contribution of Brønsted vs. Lewis acid sites in zeolite-catalyzed reactions. |
| Modulated/Periodic Reactant Feeds | To decouple surface coverage effects and measure intrinsic kinetics. | Using concentration-modulated ethylene pulses to study site-specific polymerization kinetics. |
| Well-Defined Model Catalysts (Single Crystals, Clusters) | Provide uniform, characterized active sites to simplify network complexity. | Studying structure-sensitivity of C–C coupling on Cu(100) vs. Cu(111) single crystals. |
| In Situ Calibration Gases (for MS/GC) | For quantitative conversion of detector signal to partial pressure/flux. | Preparing known mixtures of CH₄/CO/CO₂ in H₂ for calibrating MS signals during methanation. |
| Computational Catalysis Database (e.g., CatApp, NOMAD) | Source of DFT-calculated adsorption energies and barriers for network modeling. | Screening metals for optimal *OCHO vs. *CO binding to favor formate pathway in CO₂ reduction. |
Validating Catalyst Design: From Model Systems to Scalable Processes
The Sabatier principle postulates that optimal catalytic activity arises from an intermediate strength of reactant adsorption—too weak yields no activation, too strong leads to catalyst poisoning. Modern catalyst development, particularly in pharmaceuticals and fine chemicals, requires precise benchmarking against this principle to correlate adsorption energetics with measurable performance metrics. This guide details the core experimental metrics and protocols for evaluating heterogeneous and homogeneous catalysts within this research framework.
Key Performance Metrics: Quantitative Definitions
Catalyst performance is quantified by three pillars: Activity, Selectivity, and Stability. The following table summarizes the key metrics and their calculations.
Table 1: Core Metrics for Catalytic Performance Benchmarking
| Metric Category | Specific Metric | Formula / Definition | Typical Units | Relevance to Sabatier Principle |
|---|---|---|---|---|
| Activity | Turnover Frequency (TOF) | (Moles of product) / (Moles of active site × Time) | s⁻¹, h⁻¹ | Direct measure of the rate per active site at intermediate adsorption strength. |
| Areal Activity | (Moles of product) / (Catalyst surface area × Time) | mol·m⁻²·s⁻¹ | Correlates activity with available surface for adsorption. | |
| Specific Activity | (Moles of product) / (Mass of catalyst × Time) | mol·g⁻¹·h⁻¹ | Common for rapid screening, mass-dependent. | |
| Selectivity | Product Selectivity (Sᵢ) | (Moles of desired product i) / (Total moles of all products) × 100% | % | Indicates catalyst's ability to guide reaction along desired pathway, avoiding strong adsorption of by-products. |
| Faradaic Efficiency (Electro) | (Charge for desired product) / (Total charge passed) × 100% | % | Electrochemical specificity. | |
| Stability | Conversion Decay Rate | -dX/dt, where X = conversion | %·h⁻¹ | Rate of deactivation, often linked to strong adsorption (poisoning) or sintering. |
| Time-on-Stream (TOS) Half-Life | Time for activity (TOF) to drop to 50% of initial | h, days | Operational lifetime metric. | |
| Total Turnover Number (TTON) | Total moles of product per mole of active site before deactivation | Dimensionless | Total useful cycles, integrating activity and stability. |
Experimental Protocols for Metric Determination
Protocol for Measuring Turnover Frequency (TOF)
Objective: Determine the intrinsic activity per catalytically active site. Materials: Fixed-bed or batch reactor, GC/HPLC for analysis, catalyst sample, titrants for active site counting (e.g., CO for chemisorption, NaAuCl₄ for titration). Procedure:
- Active Site Quantification (Critical Step):
- For metals: Use CO Pulse Chemisorption or H₂ Titration. Assume a stoichiometry (e.g., CO:Surface Metal Atom = 1:1).
- For acids: Use NH₃-Temperature Programmed Desorption (TPD) or titration with bases.
- Calculate total moles of active sites (N_sites).
- Kinetic Measurement:
- Perform reaction at very low conversion (<10%) to avoid mass/heat transfer limitations.
- Measure initial rate of product formation (r, in mol·s⁻¹).
- Calculation: TOF = r / N_sites.
Protocol for Assessing Selectivity
Objective: Determine distribution of products under standardized conditions. Materials: Analytical setup (GC-MS, HPLC, NMR), calibrated for all reactants and possible products. Procedure:
- Conduct reaction at a specified conversion (e.g., 20-40%).
- Quench reaction rapidly and analyze product mixture quantitatively.
- For each product i, calculate: Sᵢ = (nᵢ / Σn_products) × 100%, where n is moles.
Protocol for Stability/Deactivation Testing
Objective: Measure loss of activity over extended time. Materials: Continuous-flow reactor or repeated batch setup, online analysis. Procedure:
- Establish initial activity (TOF or conversion) under standard conditions.
- Run reaction continuously (Time-on-Stream test) or over multiple batch cycles.
- Monitor key activity and selectivity metrics at regular intervals.
- Plot activity vs. time/cycles. Calculate decay rate or TTON.
The Scientist's Toolkit: Essential Research Reagent Solutions
Table 2: Key Reagents and Materials for Catalyst Benchmarking Experiments
| Item | Function in Benchmarking | Example/Specification |
|---|---|---|
| Chemisorption Titrants | Quantify number of surface-active sites (for TOF). | CO (5% in He), H₂ (5% in Ar), O₂ (for oxidation state titration). |
| Temperature Programmed Desorption (TPD) Gases | Probe adsorption strength & acid/base site density. | NH₃ (for acid sites), CO₂ (for basic sites). |
| Calibration Gas Mixtures | Quantitative analysis of reaction products & selectivity. | Certified GC standards for expected reactants/products (e.g., 1% each in N₂). |
| Catalyst Precursors | For reproducible synthesis of active phases. | H₂PtCl₆·6H₂O, HAuCl₄·3H₂O, (NH₄)₆Mo₇O₂₄·4H₂O. |
| High-Surface-Area Supports | Provide dispersed active sites. | γ-Al₂O₃, SiO₂, TiO₂ (P25), CeO₂, Activated Carbon. |
| Mass Transfer Limitation Test Reagents | Verify kinetic, not diffusive, control. | Vary catalyst particle size (crushing) or agitation speed (in slurry). |
Visualization of Concepts and Workflows
Title: Catalyst Benchmarking Workflow & Sabatier Context
Title: Sabatier Principle: Activity vs. Adsorption Strength
This whitepaper details advanced characterization methodologies central to a broader research thesis investigating the Sabatier principle in the context of catalyst and drug-target interactions. The Sabatier principle posits an optimal intermediate binding affinity for maximal catalytic activity—too weak leads to poor substrate adsorption, while too strong inhibits product desorption. Validating binding hypotheses, whether for heterogeneous catalysts or biological drug targets, requires a multi-modal approach to directly observe and quantify interactions, binding sites, and resultant conformational changes. Spectroscopy and microscopy provide the complementary, high-resolution data necessary to move beyond inferential models and empirically map the binding landscape, thereby enabling the rational design of molecules and materials with optimized activity.
Core Spectroscopic Techniques
X-ray Photoelectron Spectroscopy (XPS)
XPS provides quantitative elemental composition and chemical state information from the top 1-10 nm of a surface. It is critical for validating the binding of catalytic metals or probe molecules onto a support material and for assessing oxidation states, a key parameter in Sabatier-type activity correlations.
Experimental Protocol for Catalyst Characterization:
- Sample Preparation: The catalyst powder is pressed onto a conductive indium foil or mounted on a stainless-steel stub using double-sided carbon tape. For in situ studies, samples are pre-treated in a reaction cell attached to the XPS system (e.g., under H₂ at 300°C for 1 hour) and transferred under vacuum.
- Data Acquisition: The sample is introduced into an ultra-high vacuum chamber (< 10⁻⁸ mbar). A monochromatic Al Kα X-ray source (1486.6 eV) is used for excitation. Survey scans (pass energy 160 eV) identify all elements present. High-resolution scans (pass energy 20-40 eV) of regions of interest (e.g., C 1s, O 1s, Pd 3d) are performed to determine chemical states.
- Data Analysis: Spectra are calibrated using the C 1s peak (adventitious carbon) at 284.8 eV. Peak fitting is performed using mixed Gaussian-Lorentzian functions after a Shirley or Tougaard background subtraction. Atomic concentrations are calculated using relative sensitivity factors.
Key Quantitative Data from Representative XPS Analysis: Table 1: XPS Analysis of Pd/TiO₂ Catalyst Before and After CO Adsorption
| Element/Region | Binding Energy (eV) Pre-CO | Binding Energy (eV) Post-CO | Atomic % Pre-CO | Atomic % Post-CO | Interpretation |
|---|---|---|---|---|---|
| Ti 2p₃/₂ | 458.5 | 458.5 | 22.1 | 21.8 | TiO₂ support unchanged. |
| O 1s (Lattice) | 529.8 | 529.8 | 57.3 | 57.1 | Lattice oxygen unchanged. |
| Pd 3d₅/₂ | 335.1 | 335.9 | 0.9 | 0.9 | Shift indicates electron donation from Pd to CO, validating chemisorption. |
| C 1s (Advent.) | 284.8 | 284.8 | 19.7 | 19.2 | Adventitious carbon reference. |
| C 1s (CO) | - | 286.1 | - | 0.9 | New peak confirms adsorbed CO species. |
In Situ Fourier-Transform Infrared (FTIR) Spectroscopy
In situ FTIR monitors molecular vibrations of surface species under reactive conditions, providing direct evidence of binding modes and intermediate formation.
Experimental Protocol for Probing Adsorption:
- Cell Setup: A transmission or diffuse reflectance in situ cell (e.g., Harrick Scientific) with KBr windows is used. The catalyst wafer or powder is loaded and pre-treated with He/Ar flow at elevated temperature.
- Background Collection: A background spectrum (typically 64-256 scans at 4 cm⁻¹ resolution) is collected under inert atmosphere or vacuum after pre-treatment.
- Adsorption Measurement: The probe gas (e.g., 1% CO in He) is introduced at the desired temperature. Spectra are collected continuously. Difference spectra (sample spectrum minus background) highlight adsorbed species.
Surface Plasmon Resonance (SPR) and Bio-Layer Interferometry (BLI)
SPR and BLI are label-free, real-time techniques for quantifying biomolecular binding kinetics (ka, kd) and affinity (KD), directly relevant to drug-target binding hypotheses.
Experimental Protocol for SPR Protein-Ligand Analysis:
- Surface Functionalization: A carboxymethylated dextran sensor chip is activated with EDC/NHS chemistry. The target protein is diluted in sodium acetate buffer (pH 4.5-5.5) and immobilized via amine coupling to a specified resonance unit (RU) level. Remaining active groups are capped with ethanolamine.
- Kinetic Run: Running buffer (e.g., PBS with 0.05% Tween-20, pH 7.4) is flowed continuously. Analyte (drug candidate) is injected at a series of concentrations (e.g., 0.1 nM to 1 µM) in a randomized order, with association and dissociation phases monitored.
- Data Processing: A reference flow cell signal is subtracted. The resulting sensograms are fit to a 1:1 Langmuir binding model using the instrument software (e.g., Biacore Evaluation Software) to extract ka (association rate constant), kd (dissociation rate constant), and KD (kd/ka).
Key Quantitative Data from Representative SPR/BLI Analysis: Table 2: Binding Kinetics of Therapeutic Antibodies to Soluble Antigen
| Antibody | ka (1/Ms) | kd (1/s) | KD (nM) | Interpretation in Sabatier Context |
|---|---|---|---|---|
| mAb-A | 1.2 x 10⁵ | 8.0 x 10⁻⁴ | 6.7 | Optimal moderate affinity; facilitates target engagement and release (turnover). |
| mAb-B | 2.5 x 10⁵ | 5.0 x 10⁻³ | 20.0 | Faster on/off rates, weaker binding; may be insufficient for efficacy. |
| mAb-C | 4.0 x 10⁴ | 1.0 x 10⁻⁵ | 0.25 | Very high affinity; risks "product inhibition," poor tissue penetration, and slow off-target clearance. |
Advanced Microscopy Techniques
1In SituEnvironmental Transmission Electron Microscopy (ETEM)
ETEM allows for the direct, atomic-scale observation of catalysts under reactive gas environments and elevated temperatures, enabling the visualization of dynamic binding and structural changes.
Experimental Protocol for Catalyst Observation:
- Sample Prep: Catalyst powder is dispersed in ethanol and sonicated. A drop is deposited onto a specialized ETEM holder with a MEMS-based heating chip containing electron-transparent windows.
- In Situ Experiment: The holder is inserted, and the microscope column is evacuated. A controlled gas mixture (e.g., 5 mbar H₂) is introduced. The sample is heated to the reaction temperature (e.g., 300°C) using the chip's integrated heater.
- Imaging/ Spectroscopy: High-resolution TEM (HRTEM) or scanning TEM (STEM) images are captured to observe morphology changes. Electron energy loss spectroscopy (EELS) or energy-dispersive X-ray spectroscopy (EDS) can be performed simultaneously to analyze chemical states.
Super-Resolution Fluorescence Microscopy (e.g., STORM)
STORM bypasses the diffraction limit, allowing for nanoscale mapping of protein colocalization and clustering upon ligand binding in fixed cells.
Experimental Protocol for Receptor Clustering Analysis:
- Sample Labeling: Cells expressing the target receptor are fixed, permeabilized, and labeled with a primary antibody, followed by a photoswitchable dye-conjugated secondary antibody (e.g., Alexa Fluor 647).
- Imaging Buffer: A STORM imaging buffer containing enzymatic oxygen scavengers (Glucose Oxidase/Catalase) and a thiol (e.g., β-mercaptoethylamine) is added to induce photoswitching.
- Data Acquisition: A high-power 640 nm laser activates a sparse subset of dyes. Their positions are precisely localized by fitting the point spread function. This process is repeated for 10,000-50,000 frames to reconstruct all emitter positions.
- Cluster Analysis: Localizations are rendered into a super-resolution image. Cluster analysis algorithms (e.g., DBSCAN) quantify the number and size of receptor clusters in untreated vs. ligand-treated conditions.
The Scientist's Toolkit: Key Research Reagent Solutions
Table 3: Essential Materials for Binding Validation Experiments
| Item | Function/Application | Example Product/Catalog |
|---|---|---|
| Functionalized SPR/BLI Sensor Chips | Provide a surface for covalent immobilization of targets (proteins, DNA). | Cytiva Series S CM5 Chip; Sartorius Octet SA Biosensors. |
| Photoswitchable Fluorescent Dyes | Enable super-resolution microscopy via stochastic activation. | Alexa Fluor 647, CF680 for STORM/dSTORM. |
| In Situ ETEM Holders & MEMS Chips | Enable controlled gas environment and heating inside TEM. | Protochips Atmosphere or DENSolutions Wildfire holders. |
| Deuterated Solvents for NMR | Provide a non-interfering signal for NMR spectroscopy of molecular binding. | D₂O, Deuterated DMSO (DMSO-d6), CDCl₃. |
| High-Purity Calibration Gases | For in situ FTIR, XPS, and ETEM studies under controlled atmospheres. | 10% CO/He, 5% H₂/Ar, Research Grade O₂ (99.999%). |
| Reference Materials for Spectroscopy | Calibrate binding energy (XPS) or Raman shift. | Clean Au foil (Au 4f₇/₂ at 84.0 eV), Silicon wafer (520.7 cm⁻¹ Raman peak). |
| Stable Isotope-Labeled Ligands/Substrates | Trace specific binding pathways using MS or NMR. | ¹³C-CO, D-glucose-d7, ¹⁵N-labeled amino acids. |
Integrated Workflow and Data Correlation Diagram
Diagram Title: Integrated Workflow for Binding Hypothesis Validation.
The rigorous validation of binding hypotheses is a cornerstone for advancing research governed by the Sabatier principle, bridging catalysis and drug discovery. The synergistic application of spectroscopy—yielding quantitative kinetic and chemical state data—and microscopy—providing direct spatial and temporal visualization—creates an incontrovertible evidence base. This multi-modal framework moves correlation research beyond simple activity measurements, enabling the construction of detailed structure-activity relationships. By precisely mapping the binding landscape, researchers can rationally design interventions that target the optimal point on the Sabatier curve, whether for a next-generation heterogeneous catalyst or a high-efficacy therapeutic.
Comparative Analysis of Homogeneous vs. Heterogeneous Catalyst Design Rules
The design of catalytic systems is governed by fundamental principles linking structure to activity, most notably the Sabatier principle. This principle posits an optimal intermediate binding energy for reactants and products—too strong leads to catalyst poisoning, too weak yields insufficient activation. This whitepaper presents a comparative analysis of how this universal principle manifests in and informs the distinct design rules for homogeneous and heterogeneous catalysts. The analysis is framed within ongoing research on correlating Sabatier-type activity volcanoes with electronic and geometric descriptors across both catalyst classes, aiming for a unified understanding of catalytic activity.
Foundational Principles: Sabatier’s Principle as the Common Framework
The Sabatier principle provides the foundational thermodynamic and kinetic framework for catalyst design. For a reaction A → B, the ideal catalyst binds the reaction intermediate I with a Gibbs free energy (ΔG°ᵢ) that is neither too high nor too low. This creates the characteristic "volcano plot" where activity peaks at an intermediate binding strength.
- Quantitative Descriptors: The binding energy of key intermediates (e.g., H for HER, *O/OH for ORR, *CO for PROX) serves as the primary descriptor.
- Homogeneous Context: ΔG°ᵢ is directly correlated with ligand electronic properties (Tolman Electronic Parameter, Hammett constants) and steric bulk (Tolman Cone Angle).
- Heterogeneous Context: ΔG°ᵢ is correlated with d-band center for transition metals, or more general electronic structure descriptors for oxides and other materials.
Table 1: Quantitative Descriptors for Sabatier Analysis
| Catalyst Class | Primary Activity Descriptor | Common Correlating Parameters | Typical Measurement/Calculation |
|---|---|---|---|
| Homogeneous | Intermediate Binding Free Energy (ΔG°ᵢ) | Ligand Electronic Parameter, Cone Angle, Metal Redox Potential | DFT Calculation, Isothermal Titration Calorimetry, Electrochemical Analysis |
| Heterogeneous | Intermediate Binding Energy (E_ads) | d-band Center, Coordination Number, Work Function | DFT Calculation, Temperature-Programmed Desorption (TPD), XPS/UPS |
Homogeneous Catalyst Design Rules
Design focuses on tailoring the first coordination sphere via ligand modification.
Core Rule Set:
- Ligand-Tuned Electronics: Electron-donating ligands increase electron density at the metal center, typically strengthening π-backdonation and weakening σ-bonding to electrophilic intermediates (e.g., *CO).
- Steric Control: Bulky ligands dictate substrate approach, enforce geometry, prevent dimerization/deactivation, and create pockets for regioselectivity.
- Lability & Coordination Site Management: Design includes labile ligands (e.g., solvents) to allow substrate access and polydentate ligands to control site occupancy and stability.
- Solubility & Compartmentalization: Catalyst must remain soluble and active under reaction conditions; design includes charged groups or solubilizing tails. Separation from products is a key design challenge.
Heterogeneous Catalyst Design Rules
Design focuses on tailoring the surface structure, composition, and support interactions.
Core Rule Set:
- Active Site Geometry & Coordination: Under-coordinated sites (steps, kinks, defects) are often more active. Strain and ligand effects in alloys modify binding energies.
- Electronic Structure Engineering: Alloying, creating intermetallics, or using supports with strong metal-support interactions (SMSI) shift the d-band center.
- Support & Promoter Effects: The support (oxide, carbon, etc.) stabilizes nanoparticles, provides spillover pathways, or offers acid/base sites for bifunctionality. Promoters (e.g., K, Ca) electronically or structurally modify the active surface.
- Porosity & Mass Transport: Design of pore architecture (micro/meso/macro) controls reactant access to active sites and product egress, critical for activity and stability.
Table 2: Comparative Design Rule Summary
| Design Aspect | Homogeneous Catalysis | Heterogeneous Catalysis |
|---|---|---|
| Active Site | Well-defined, uniform molecular complex. | Non-uniform surface sites (terraces, edges, defects). |
| Primary Design Handle | Ligand structure (electronic & steric). | Surface composition, morphology, and support. |
| Optimization Approach | Synthetic organic/inorganic chemistry. | Surface science, materials synthesis, and engineering. |
| Thermodynamic Descriptor | Metal-ligand redox potential, ligand parameters. | Adsorption energy, d-band center. |
| Separation | Major challenge (distillation, membrane). | Inherently simple (filtration, decanting). |
| Typical Applications | Asymmetric synthesis, polymerization, fine chemicals. | Bulk chemicals, energy conversion, environmental catalysis. |
Experimental Protocols for Characterization & Activity Correlation
Protocol 5.1: Generating a Heterogeneous Catalyst Volcano Plot (Hydrogen Evolution Reaction - HER)
Objective: Correlate catalytic activity with hydrogen binding energy (ΔE_H).
- Catalyst Synthesis: Prepare a series of transition metal surfaces (e.g., Pt, Ni, Co, MoS₂) via physical vapor deposition or wet impregnation on a conductive substrate.
- Descriptor Measurement (ΔEH): Use Temperature-Programmed Desorption (TPD). Saturate surface with H₂ at low T (100 K), then ramp temperature linearly while monitoring H₂ desorption (m/z=2) with a mass spectrometer. The peak desorption temperature correlates with ΔEH. Alternatively, calculate ΔE_H via Density Functional Theory (DFT).
- Activity Measurement: Perform Linear Sweep Voltammetry (LSV) in 0.5 M H₂SO₄ using a standard 3-electrode electrochemical cell. Measure current density (j) at a fixed overpotential (e.g., η = 100 mV).
- Plotting: Plot log(|j|) at η=100 mV vs. experimental or theoretical ΔE_H to generate the volcano curve.
Protocol 5.2: Determining Homogeneous Catalyst Ligand Parameters
Objective: Quantify ligand electronic (TEP) and steric (Cone Angle) properties for correlation with activity.
- Tolman Electronic Parameter (TEP) Measurement:
- Synthesize the Ni(CO)₃L complex for the ligand L of interest.
- Record the IR spectrum in the carbonyl stretching region (1800-2200 cm⁻¹) in an inert solvent (e.g., cyclohexane).
- Identify the A₁ symmetric stretching frequency (ν(CO)).
- Calculate TEP = ν(CO) in cm⁻¹. Higher TEP indicates a more electron-withdrawing ligand.
- Tolman Cone Angle Measurement:
- Using a molecular modeling software (e.g., Spartan, Avogadro), build the ligand L coordinated to a spherical metal center (M) with a standard M–P bond length (e.g., 2.28 Å for Ni–P).
- Define the cone originating at the metal center, tangent to the van der Waals radii of the outermost ligand atoms.
- Calculate the apex angle of this cone in degrees.
Diagram Title: Workflow for Catalyst Activity Correlation
The Scientist's Toolkit: Essential Research Reagents & Materials
Table 3: Key Research Reagent Solutions
| Item | Function / Application | Catalyst Class |
|---|---|---|
| Deuterated Solvents (e.g., CDCl₃, DMSO-d₆) | Solvent for NMR spectroscopy to monitor homogeneous catalytic reactions and characterize complexes. | Homogeneous |
| Ligand Libraries (Phosphines, NHC precursors, Salens) | Modular building blocks for systematic exploration of steric and electronic effects on metal centers. | Homogeneous |
| High-Pressure Reactors (Parr, autoclaves) | Conduct reactions under controlled pressures of gases (H₂, CO, O₂) relevant to hydrogenation, carbonylation, etc. | Both |
| Supported Metal Precursors (e.g., Pt(NH₃)₄(NO₃)₂ on Al₂O₃) | Standard precursors for the synthesis of well-defined heterogeneous catalysts via impregnation. | Heterogeneous |
| Ultra-High Purity Gases (H₂, CO, O₂) with Purifiers | Essential for surface science studies (TPD, TPR) and catalytic tests to avoid poisoning by impurities. | Heterogeneous |
| Single Crystal Metal Disks (Pt(111), Au(111)) | Model substrates for fundamental studies of adsorption and reaction kinetics on well-defined surfaces. | Heterogeneous |
| Titration Standards (for GC, TCD calibration) | Quantitative analysis of gaseous or liquid products from catalytic reactors. | Both |
| Electrolyte Solutions (e.g., 0.1 M HClO₄, 0.1 M KOH) | Standard media for evaluating electrocatalytic activity (HER, ORR, CO2RR) in aqueous systems. | Both |
The design rules for homogeneous and heterogeneous catalysts, while divergent in practical application, converge on the universal Sabatier principle. Homogeneous catalysis achieves optimization through precise molecular-level control of the primary coordination sphere, whereas heterogeneous catalysis manipulates the collective electronic and geometric properties of extended surfaces. The future of catalyst design lies in bridging this divide—through the development of single-atom catalysts that feature homogeneous-like active sites on heterogeneous supports, and via the application of advanced in situ/operando characterization and high-throughput computational screening to map multidimensional volcano relationships. This integrated approach will accelerate the discovery of next-generation catalysts for sustainable chemical synthesis and energy technologies.
Within the framework of a broader thesis on Sabatier principle and catalyst activity correlation research, this guide addresses the fundamental "materials gap." This gap refers to the disconnect between catalyst characterization and model reactions performed under Ultra-High Vacuum (UHV) conditions and the catalyst's behavior under realistic, high-pressure, and high-temperature reaction conditions. The Sabatier principle posits an optimal intermediate adsorbate-catalyst bond strength for maximum activity. The core challenge is to determine this optimal strength from UHV measurements and predict catalytic performance under industrial operating conditions, where surface coverages, adsorbate structures, and oxidation states can be radically different.
Core Challenges and Conceptual Framework
The discrepancy arises from several key differences between UHV and ambient pressure environments:
Table 1: The UHV vs. Real-Conditions Gap
| Parameter | Ultra-High Vacuum (UHV) Environment | Real/Practical Reaction Conditions |
|---|---|---|
| Pressure | 10-7 to 10-12 mbar | 1 mbar to 100+ bar |
| Surface Coverage | Low, sub-monolayer (for adsorption studies) | High, often multilayers or full coverage |
| Adsorbate Structure | Often well-defined, isolated species | Dense, complex networks; lateral interactions significant |
| Catalyst Oxidation State | Often reduced or pristine metal | May be oxidized or carbided under reaction mixture |
| Mass Transport | Negligible | Critical; governed by gas/liquid flow |
| Primary Techniques | XPS, AES, LEED, TPD, STM | AP-XPS, PM-IRAS, Sum-Frequency Generation, Reactor studies |
Experimental Protocols for Bridging the Gap
High-Pressure Cell Linked to UHV System (HP-Cell)
This is the seminal methodology for direct correlation.
Detailed Protocol:
- Sample Preparation: A single crystal or thin film model catalyst is prepared in the UHV chamber via repeated cycles of Ar+ sputtering (1-3 keV, 10-30 minutes) and annealing (up to 90% of melting point, in UHV or controlled gas).
- UHV Characterization: The clean surface is characterized using Low-Energy Electron Diffraction (LEED) for structure, X-ray Photoelectron Spectroscopy (XPS) for composition/oxidation state, and Temperature-Programmed Desorption (TPD) of probe molecules (e.g., CO) to establish adsorption energy baselines.
- High-Pressure Reaction: The sample is transferred, without breaking vacuum, to a dedicated microreactor cell (high-pressure cell) attached to the UHV chamber. The cell is sealed and pressurized with the reactant gas mixture (e.g., 1 bar CO + H2 for methanation).
- In-situ/Operando Analysis (Optional): Some systems allow for vibrational spectroscopy (IRAS) or other measurements through windows during reaction.
- Post-Reaction UHV Analysis: The gas is evacuated from the high-pressure cell, and the sample is transferred back to the UHV analysis chamber. XPS and TPD are repeated immediately to identify changes in surface composition, oxidation state, and adsorbate binding energies induced by the high-pressure reaction.
- Correlation: The post-reaction UHV data is directly correlated with the catalytic activity/selectivity measured by gas chromatography (GC) during step 4.
Ambient Pressure X-Ray Photoelectron Spectroscopy (AP-XPS)
This technique directly probes the surface under near-realistic conditions.
Detailed Protocol:
- The model catalyst (single crystal or nanoparticle model) is loaded into an AP-XPS system.
- The chamber is back-filled with the reactive gas mixture at pressures ranging from 0.1 mbar to several bar. A series of differentially pumped electrostatic lenses allows the emitted photoelectrons to travel from the high-pressure region to the detector under high vacuum.
- XPS spectra (core levels like C 1s, O 1s, metal peaks) are acquired as a function of temperature and gas composition.
- The evolution of chemical states (e.g., metallic Pt0 vs. PtOx, types of surface carbon) is tracked in real-time and correlated with simultaneous mass spectrometry (MS) data to link surface composition to catalytic turnover.
Pressure-Gap Reactor with In-situ Spectroscopy
Detailed Protocol:
- A well-defined catalyst (e.g., monodisperse nanoparticles on a planar support) is placed in a miniature flow reactor equipped with spectroscopic windows.
- Reactant gases flow over the catalyst at pressures from UHV to ambient, controlled by precise leak valves and pumps.
- Polarization-Modulation Infrared Reflection Absorption Spectroscopy (PM-IRAS) is used to identify the nature and coverage of adsorbed intermediates (e.g., CO, formates, carbonates) across the pressure gap.
- Reactor effluent is analyzed by online MS or GC to measure reaction rates (turnover frequency - TOF) and selectivity.
- The in-situ spectroscopic signature of intermediates is plotted against the measured TOF as a function of pressure and temperature to identify the active surface phase.
Visualizing the Workflow and Relationships
Title: Bridging the Materials Gap Workflow
Title: HP-Cell Experimental Protocol Steps
The Scientist's Toolkit: Key Research Reagent Solutions
Table 2: Essential Materials and Reagents for Bridging Studies
| Item | Function / Purpose | Example Specifications / Notes |
|---|---|---|
| Single Crystal Electrodes/Disks | Atomically flat, well-defined model surfaces for UHV studies. Serve as the foundational "simple system." | Pt(111), Rh(110), Cu(100). Orientation accuracy <0.1°. |
| Calibrated Gas Mixtures | For precise, reproducible high-pressure reaction studies and calibration of mass spectrometers. | 5% CO/He, 10% O₂/Ar, Synthesized "Water-Gas Shift" mix (CO/CO₂/H₂/H₂O). |
| Sputtering Gas (Argon, 6.0) | For in-situ cleaning of model catalyst surfaces in UHV via ion bombardment. | Research purity (99.9999%), typically used at 1-5 x 10⁻⁵ mbar in ion gun. |
| Calibration Gases for XPS | To perform binding energy scale calibration and verify spectrometer function. | Au foil (Au 4f7/2 at 84.0 eV), Cu foil (Cu 2p3/2 at 932.67 eV), Adventitious C (C 1s at 284.8 eV). |
| Temperature Calibration Materials | For accurate temperature measurement of the sample under UHV and high-pressure conditions. | NiCr-NiAl (Type K) thermocouple wire; optical pyrometer for >1000 K. |
| Model Nanoparticle Catalysts | Bridge between single crystals and real powder catalysts. Prepared by physical deposition or colloidal synthesis. | Size-selected Pt nanoparticles deposited on planar SiO₂/TiO₂ supports. |
| UHV-Compatible Sealing Materials | For constructing high-pressure cells and ensuring vacuum integrity during sample transfer. | Copper gaskets (for ConFlat flanges), Kalrez O-rings for high-temperature windows. |
| Reference Catalysts | Benchmark materials to validate reactor and activity measurement setups. | EuroPt-1 (6.3% Pt/SiO₂) for hydrogenation, NIST-standard materials. |
Data Correlation: From UHV Descriptors to Real Activity
Table 3: Correlation of UHV-Derived Parameters with Catalytic Performance
| Catalytic Reaction (Example) | Key UHV-Derived Parameter (Sabatier Descriptor) | Measurement Technique | Correlation with Real-Condition Activity (TOF) | Bridging Experiment Used |
|---|---|---|---|---|
| CO Oxidation on Pt-group metals | Adsorption energy of CO (Eads,CO) | TPD, microcalorimetry | Volcano plot: Maximum TOF at intermediate Eads,CO. Strongly bound CO poisons surface. | AP-XPS, HP-Cell |
| Ammonia Synthesis on Fe, Ru | Dissociative adsorption energy of N₂ (activation barrier) | Molecular beam scattering, TPD of N atoms | Lower barrier correlates with higher activity. Determines pressure & temperature requirements. | High-Pressure Reaction + post-UHV |
| Steam Reforming on Ni | Carbon (C) formation vs. removal energy | XPS of carbide, TPD of CHx fragments | Catalysts that minimize strong, graphitic C under UHV show higher coking resistance at high P. | AP-XPS under CH₄/H₂O mix |
| Water-Gas Shift on Cu/ZnO | Adsorption energy of Formate (HCOO*) intermediate | IRAS, TPD of formic acid | Formate stability (from TPD peak temp.) correlates with activity; optimal intermediate strength. | PM-IRAS across pressure gap |
Bridging the materials gap is an iterative process, firmly rooted in the Sabatier principle's search for the optimal adsorption strength descriptor. The integration of UHV surface science, high-pressure operando spectroscopy, and advanced theoretical calculations is creating a new paradigm. Future directions involve closing the "complexity gap" by studying bifunctional sites and liquid-solid interfaces, and employing machine learning to map the multidimensional parameter space (UHV descriptors, reaction conditions) directly to catalytic activity, enabling the rational design of next-generation catalysts.
The Sabatier principle posits an optimal binding energy for reactants to a catalyst surface, maximizing activity. This conceptual "volcano plot" optimum represents a peak catalytic performance. However, long-term industrial application is constrained by dynamic surface processes that lead to deactivation, representing the practical limits of this theoretical optimum. This whitepaper examines these deactivation mechanisms within the context of ongoing research correlating the Sabatier principle with real-world catalyst longevity, providing a technical guide for researchers.
Core Deactivation Mechanisms Undermining the Sabatier Optimum
Catalyst deactivation moves the system off the Sabatier peak. The primary mechanisms are:
- Chemical Deactivation: Poisoning (strong, irreversible chemisorption of impurities) and fouling (physical deposition of carbonaceous species or coke).
- Thermal Deactivation: Sintering (loss of active surface area via crystallite growth) and solid-state transformation (phase changes).
- Mechanical Deactivation: Attrition and crushing of catalyst particles.
These mechanisms are often interconnected and accelerated by the very conditions (temperature, pressure, reactant concentration) that drive optimal Sabatier activity.
Quantitative Data on Catalyst Deactivation
Table 1: Common Catalyst Deactivation Modes and Rates
| Catalyst System | Primary Reaction | Main Deactivation Mechanism | Typical Activity Half-life | Key Influencing Factors |
|---|---|---|---|---|
| Ni/Al₂O₃ | Methane Steam Reforming | Sintering, Coke Fouling | 2-4 years | T > 700°C, S/C ratio |
| Pt/Al₂O₃ | Automotive Exhaust Oxidation | Thermal Sintering, Poisoning (P, S) | 5-10 years | Transient T > 900°C, fuel impurities |
| Zeolite (ZSM-5) | Fluid Catalytic Cracking | Coke Deposition, Dealumination | Seconds (regenerated) | High coking feedstock |
| Cu/ZnO/Al₂O₃ | Methanol Synthesis | Sintering, Poisoning (S, Cl) | 3-6 years | Feed purity, T excursions |
| Enzymatic Catalysts | Various Biotransformations | Denaturation, Inhibition | Hours-Days | pH, T, solvent |
Table 2: Impact of Operating Conditions on Deactivation Rate
| Condition Variable | Typical Sabatier Optimum Range | Impact on Deactivation | Mechanism Accelerated |
|---|---|---|---|
| Temperature | Defined by kinetics | Exponential increase | Sintering, coking, evaporation |
| Pressure | Defined by equilibrium | Increased fouling/coking | Higher surface coverage |
| Feedstock Purity | Not a factor in principle | Linear to exponential | Poisoning, fouling |
| Space Velocity | High for mass transfer | Can reduce fouling | Alters residence time for side reactions |
Experimental Protocols for Studying Deactivation
Protocol 4.1: Accelerated Aging Test for Thermal Sintering
Objective: Quantify loss of active surface area under elevated temperature.
- Pre-treatment: Reduce catalyst sample (typically 100-500 mg) in pure H₂ at standard reduction temperature for 2 hours.
- Aging: Switch to inert atmosphere (N₂, Ar) and ramp temperature to a predetermined stress temperature (e.g., 150°C above normal operating T). Hold for 2-24 hours.
- Characterization: Cool rapidly. Perform chemisorption (H₂, CO) or measure active site count via a standardized probe reaction (e.g., N₂O decomposition for surface Cu) to determine remaining dispersion.
- Analysis: Model dispersion loss versus time to extract sintering kinetics (e.g., power law, atomic migration models).
Protocol 4.2: Coke Formation and Analysis (Temperature-Programmed Oxidation - TPO)
Objective: Quantity and characterize carbonaceous deposits.
- Deactivation: Expose catalyst to reacting feed under study conditions for a set time-on-stream.
- Cooling/Transfer: Cool in inert gas, transfer to TPO reactor without air exposure.
- TPO Run: Heat linearly (e.g., 10°C/min) in a dilute O₂/He stream (2% O₂).
- Detection: Monitor CO₂ production via mass spectrometer or non-dispersive IR detector.
- Analysis: Integrate CO₂ peaks to quantify total coke. Peak temperatures indicate coke reactivity/graphiticity.
Protocol 4.3: Poisoning Resistance Test
Objective: Evaluate catalyst tolerance to specific impurities.
- Baseline Activity: Establish initial conversion/activity under reference conditions.
- Dosing: Introduce a controlled, low concentration of poison (e.g., 50 ppm H₂S in H₂) into the feed stream.
- Monitoring: Continuously measure activity as a function of time or total poison dose.
- Post-mortem: Characterize used catalyst via XPS or EDX to locate poison on surface.
Visualization of Deactivation Pathways and Research Workflows
Deactivation Pathways from Sabatier Peak
Stability Testing and Analysis Workflow
The Scientist's Toolkit: Key Research Reagent Solutions
Table 3: Essential Materials for Deactivation Studies
| Item | Function & Rationale |
|---|---|
| High-Purity Gases (H₂, O₂, N₂, He) | Essential for pretreatment, reaction, and TPO/TPD experiments. Impurities can skew deactivation results. |
| Certified Calibration Gas Mixtures | For precise poisoning studies (e.g., 1000 ppm H₂S in H₂). Enables accurate dose-response measurement. |
| Model Poison Compounds | e.g., Thiophene (sulfur), Quinoline (nitrogen), TMLead (metal). Used to simulate real feedstock impurities. |
| Thermocouple-Calibrated Microunit Reactor | Allows precise temperature control and measurement during accelerated aging, critical for sintering studies. |
| Pulse Chemisorption System | Quantifies active metal surface area and dispersion before/after aging to measure sintering. |
| Temperature-Programmed (TP) Suite | TPO (oxidation), TPR (reduction), TPD (desorption) to characterize coke, reducibility, and strength of adsorption. |
| Reference Catalyst Materials (e.g., EUROPT-1, NIST standards) | Benchmarks for comparing deactivation rates across different laboratories and studies. |
| In-Situ/Operando Cells (FTIR, XRD, Raman) | Enables real-time observation of surface species, coke formation, and structural changes under reaction conditions. |
Conclusion
The Sabatier Principle remains an indispensable conceptual and practical framework for rational catalyst design in pharmaceutical research. Mastering its foundational theory enables researchers to interpret complex activity trends, while modern methodological applications dramatically accelerate the discovery of efficient and selective catalysts. Effective troubleshooting requires moving beyond the idealized volcano plot to diagnose real-world complexities in binding and kinetics. Ultimately, robust validation in relevant process conditions is essential to translate a theoretically optimal catalyst into a scalable, economical solution for API synthesis. Future directions point towards the integration of machine learning with Sabatier-based descriptors, the design of dynamic or adaptive catalysts, and the application of these principles to emerging areas like biocatalysis and electrocatalysis for green chemistry initiatives. A deep understanding of this correlation is therefore not merely academic but a critical competitive advantage in developing the next generation of therapeutic agents.